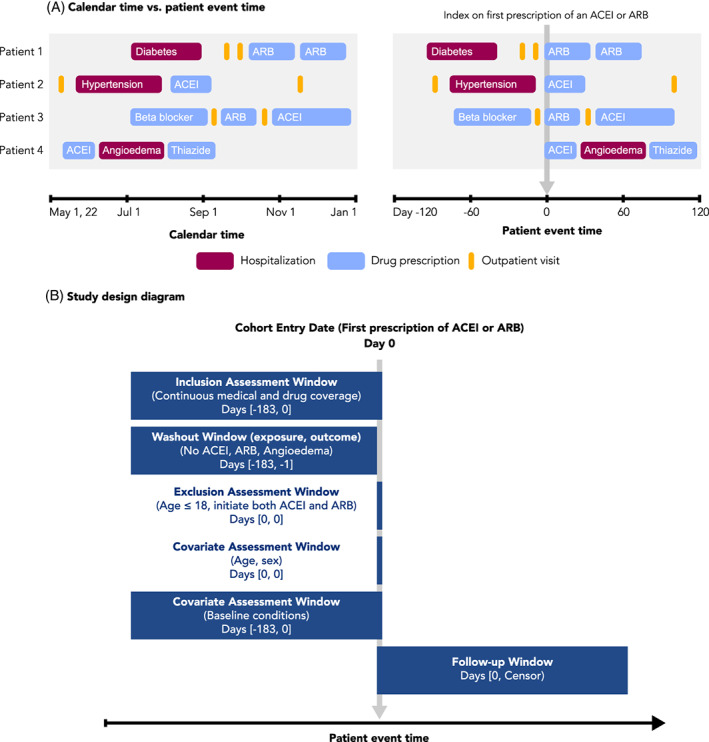
FIGURE 2.

Calendar time, patient event time, and study design diagrams. A, Patient events for four different patients are visualized, arranged according to calendar time (left) or patient event time (right). Patient event time is defined relative to an index date, in this case the first prescription of an ACE‐inhibitor (ACEI) or angiotensin receptor blocker (ARB). Events recorded as spanning intervals of time (e.g., hospitalizations and drug prescriptions) are represented as boxes, while events recorded in a single moment of time (e.g., outpatient visits) are represented as lines. B, An example study design diagram. Source: Adapted from www.repeatinitiative.org/projects.html
