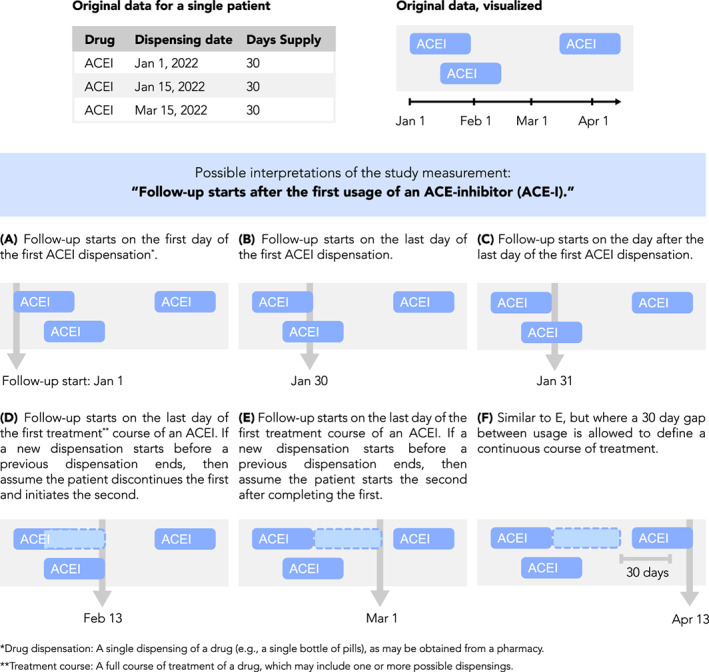
FIGURE 3.

Measurement visualization. Definitions of study measurements such as time anchors may be made ambiguous by insufficiently detailed textual descriptions or may be complicated by nuances of underlying data. For example, consider the definition “Follow‐up starts after the first use of an ACE‐inhibitor (ACE‐I).” Such a definition is ambiguous because “after the first usage” is not well‐defined, as shown here. Furthermore, periods of drug usage recorded in the data may overlap in time or have gaps between them, requiring the researcher to make assumptions about how a drug is used by a patient. Examples of this are shown here, depicting drug data for a single patient and how different interpretations of the follow‐up start date may be applied to it. Illustration of case examples of patient data and how a measurement definition accommodates them can help the researcher be more precise and take into account data nuances during protocol development
