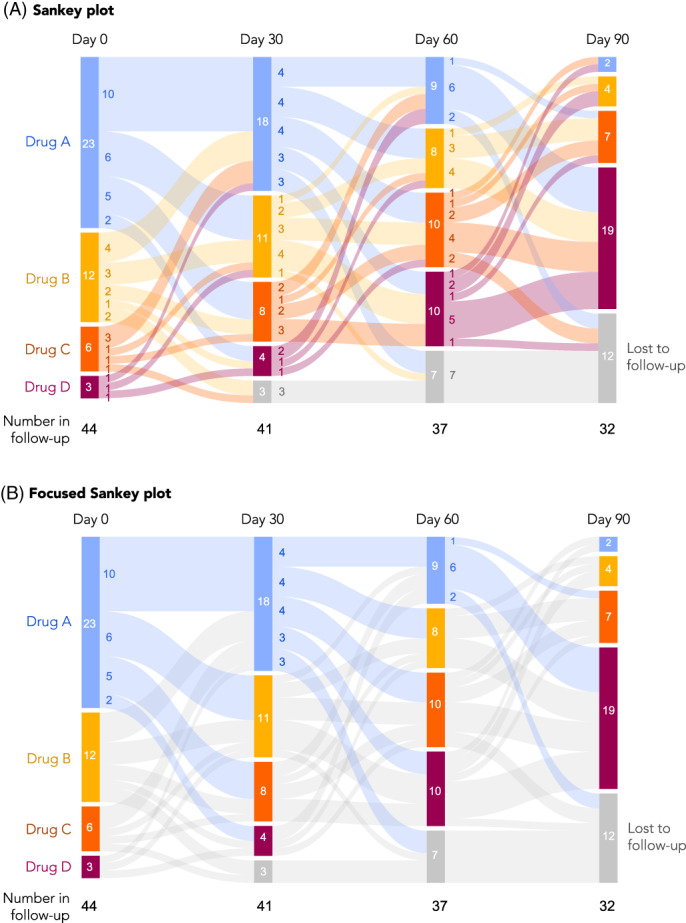
FIGURE 7.

Sankey plots. A, An example of a Sankey plot, with colors representing transitions between all groups. B, The same plot but simplified, where colors are used only to highlight specific transitions of interest. In this case, transitions from Drug A to any other drug are highlighted. Other options to focus the presentation are also possible, such as highlighting transitions to higher lines of therapy (e.g., Drug A to B, B to C, A to C, etc.)
