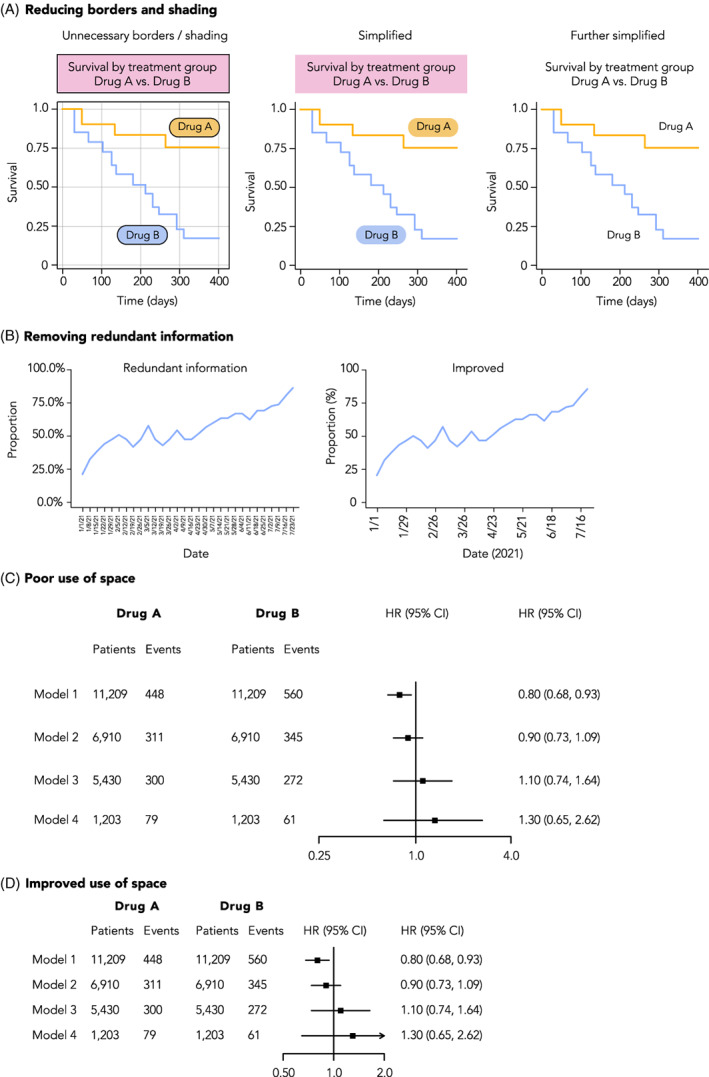
FIGURE 8.

Improving the visual style of figures. A, Plots can be Simplified by removing design elements that do not contribute to understanding of the data, such as superfluous shading or line borders, as shown here. B, Redundant information should be removed from plots, such as repeated percentage signs on axis labels, or over‐abundant tick mark labels. C, Careful consideration should be given to the use of space in a plot. In this example of a forest plot, there is an over‐abundant amount of spacing between rows, columns, and the scale of the X‐axis on the forest plot. D, An example of the same plot but with improved use of space
