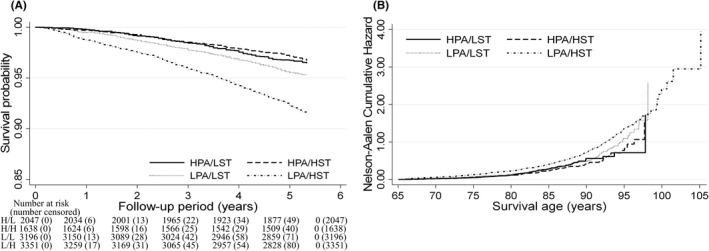
FIGURE 2.

Survival analysis for all‐cause mortality according to physical activity and sitting time status among older adults. (A) Multivariate adjusted Kaplan–Meier survival curves using inverse probability weighting and (B) Nelson–Aalen Cumulative Hazard curves using age as the time‐scale. Four groups stratified by physical activity and sitting time status: HPA/LST, high physical activity/low sitting time (H/L); HPA/HST, high physical activity/high sitting time (H/H); LPA/LST, low physical activity/low sitting time (L/L); and LPA/HST, low physical activity/high sitting time (L/H). The adjustment factors are age, sex, population density, body mass index, family structure, economic status, educational attainment, smoking status, alcohol consumption status, self‐reported health, sleep times, medication use, and number of chronic diseases.
