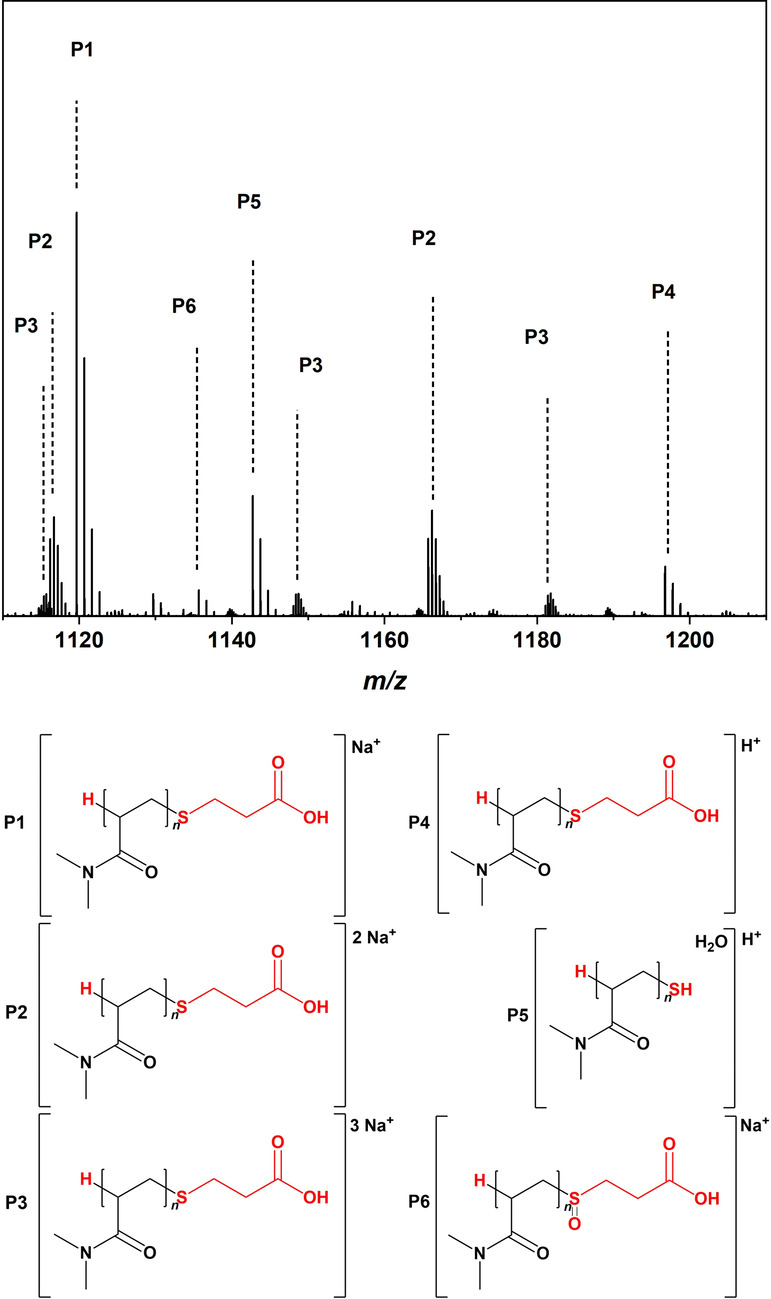
Figure 2.

ESI‐MS spectrum obtained after the polymerization of 4.04 mol L−1 DMA with 100 μL AuNR, 9 mmol L−1 AIBN and 10−2 mol L−1 CTA after 30 min irradiation with 25 GW cm−2 laser pulses at 800 nm. The irradiated solution was dissolved in 250 μL D2O prior to direct infusion. Zoom into the repeat unit of 1110–1210 and assignment of the main species P1–P6. The full mass spectrum is depicted in the Supporting Information (Figure S3), which also contains detailed isotopic pattern simulations for each peak (Figure S4).
