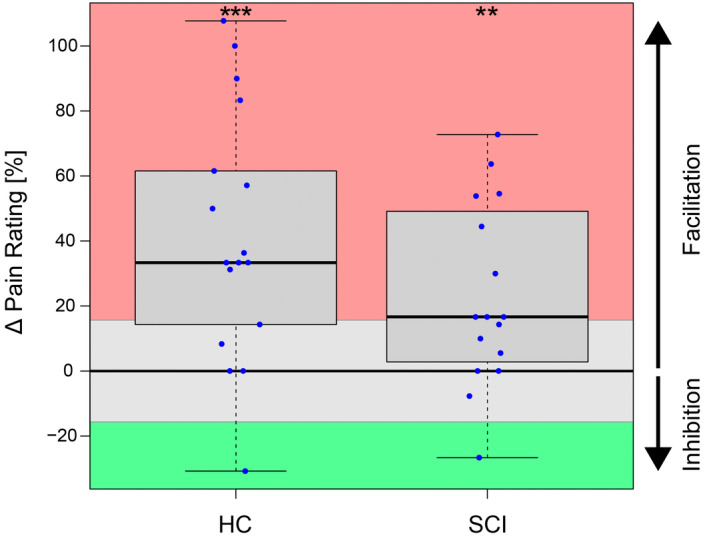
FIGURE 4.

Magnitude of temporal summation of pain (TSP). The TSP magnitude is presented as the change in pain ratings from the start of the stimulus train (first 3 averaged) to the end of the stimulus train (last 3 averaged). Red represents meaningful summation/facilitation, grey reflects no meaningful change, and green stands for meaningful inhibition. Significance levels are reported as **for p < 0.01 and ***for p < 0.001. Abbreviations: HC, healthy controls; SCI, spinal cord injury.
