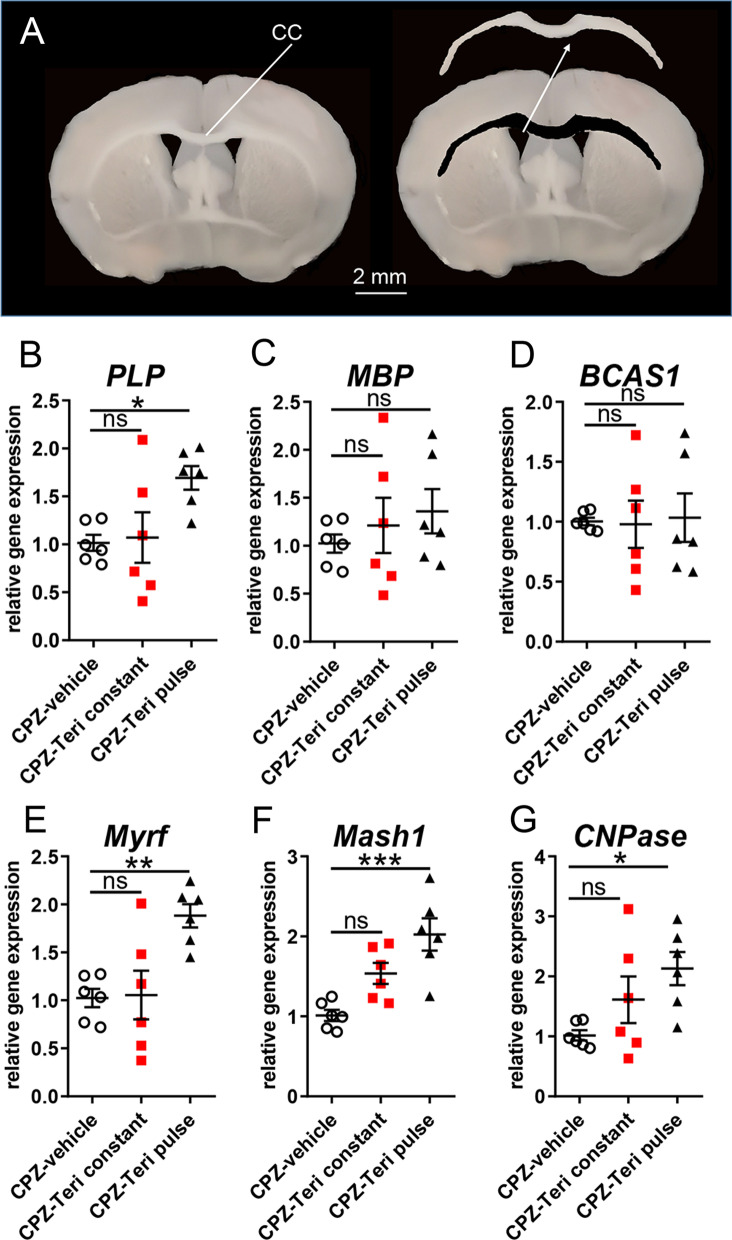
Fig. 2.
Gene expression responses upon teriflunomide stimulation. A Schematic presentation of corpus callosum tissue isolation for gene expression analysis (as shown here for the rostral CC, which was not analyzed in this study). B–G Quantitative RT–PCR of the dissected caudal corpus callosum 7d after cuprizone withdrawal (remyelination) indicated that pulsed teriflunomide application led to a significant upregulation of PLP, Myrf, Mash1 and CNPase transcript levels, whereas MBP and BCAS1 transcript levels were only mildly or not affected. GAPDH was used as reference gene. Number of animals per analysis n = 6. Data are shown as mean values (horizontal lines), while error bars represent standard error of the mean (SEM; vertical lines). Plots also show all individual data points. Statistical significance was calculated using one-way ANOVA with Tukey post-test (B–G). Data were considered statistically significant (95% confidence interval) at *p < 0.05, **p < 0.01, ***p < 0.001

