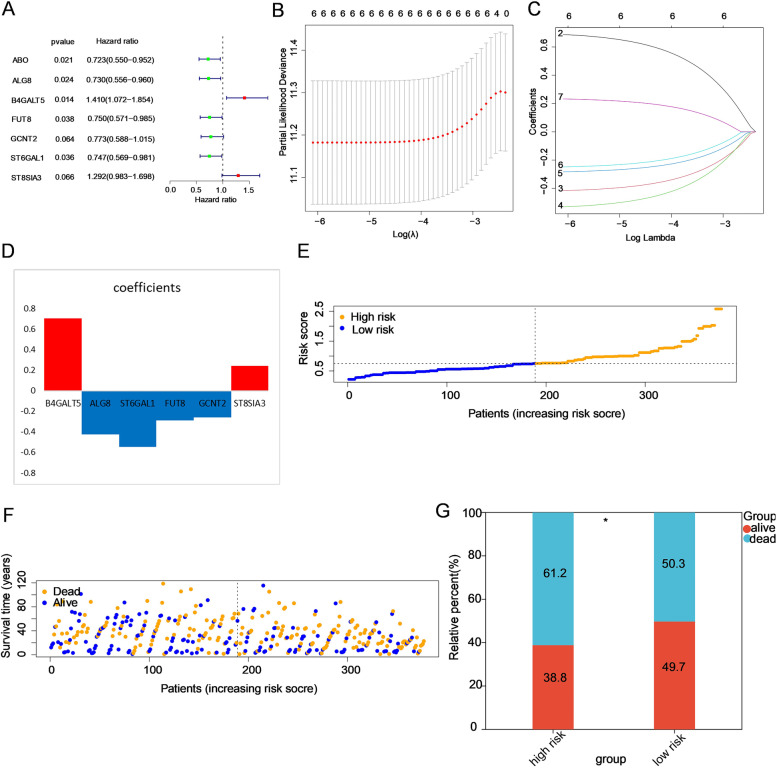
Fig. 3.
Construction of a prognostic risk model on the basis of these differentially expressed GTs. A Univariate Cox regression analysis of GTs. Factors with P < 0.1 are shown. B-D The process of establishing a risk signature with six glycosyltransferase genes. Coefficients were calculated by multivariate Cox regression by LASSO. E The distribution of risk scores in the prognostic model. F The distribution of survival status in the prognostic model. Patients in the high-risk group had more deaths and a shorter survival time than those in the low-risk group (the right side of the dotted line). G The proportion of deaths in two groups. *P < 0.05

