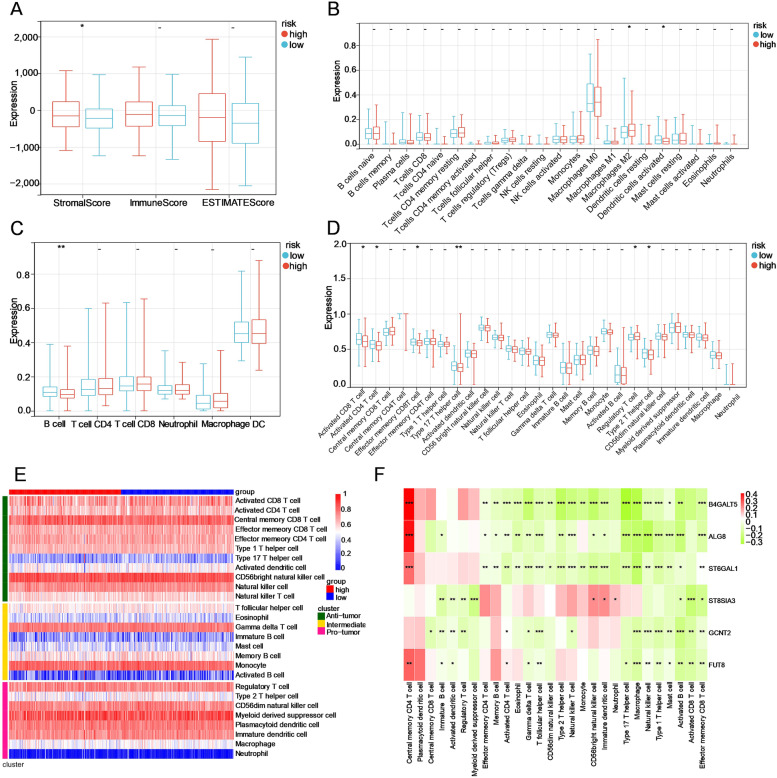
Fig. 7.
The immune infiltration landscape of the GT-based signature in OC. A Estimation of immune score, stromal score and ESTIMATE score between low- and high-risk patients using the ESTIMATE algorithm. B, C Evaluation of the proportions of immune cell subsets using the CIBERSORT and TIMER algorithms. (D, E) Boxplot and Heatmap of the infiltration levels of 28 immune cell subsets in the low- and high-risk groups calculated by ssGSEA, respectively. F Correlation heatmap between six hub genes and these 28 immune cell subdivisions. ***P < 0.001; **P < 0.01; *P < 0.05; -, not significant

