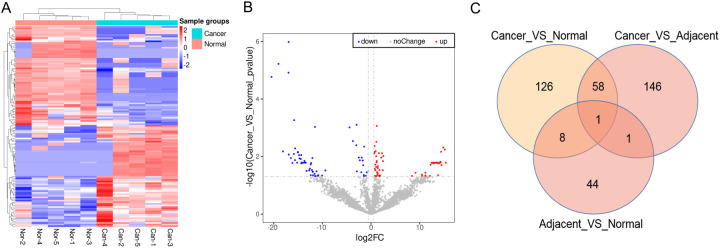
Figure 1.
Differentially expressed proteins (DEPs) in normal and COAD tissues (N = 5). A. A heatmap of DEPs in normal and COAD tissues was visualized by Pheatmap package in R. B. A volcano plot of DEPs was visualized by ggplots2 software in R. C. A Venn image for the overlapped DEPs in cancer vs. normal, cancer vs. adjacent, and adjacent vs. normal.

