. 2022 Oct 17;13(1):132–145. doi: 10.1158/2159-8290.CD-22-1074

Figure 2.

Figure 2. Development and binding properties of the R023 antibody. A, CDR sequences of R023 and its precursors and related clones. The middle images show the results of DMS of clone R011. The numbers indicate the total numbers of sequencing reads for each mutation, divided by the total number of reads for all mutations at the position, multiplied by 1000. The crosses show the wild-type residue. B, BLI sensorgrams of the interaction between R023 Fab and the indicated MHC complexes. Biotinylated R023 Fab was immobilized, and binding of soluble p/MHC samples was measured. KD values from global fitting are shown. C, BLI sensorgrams of the interaction between R023 Fab and the soto-p5/A02 complex. D, Binding titration of scFv R023 displayed on the yeast cell surface to soto-p7/03 (blue) and the soto-p7 conjugate in the absence of an MHC (open squares). E, Inhibition by free sotorasib of the interaction between soto-p7/A03 (10 nmol/L) and scFv R023 displayed on the yeast cell surface. The binding signal intensity was normalized using the value without sotorasib (100%) and in the absence of soto-p7/A03 (0%). IC50 values are reported ± standard error. In B and C, each data point shows the mean (n = 3; technical replicates) of the median fluorescence intensity. Error bars represent the standard deviation.

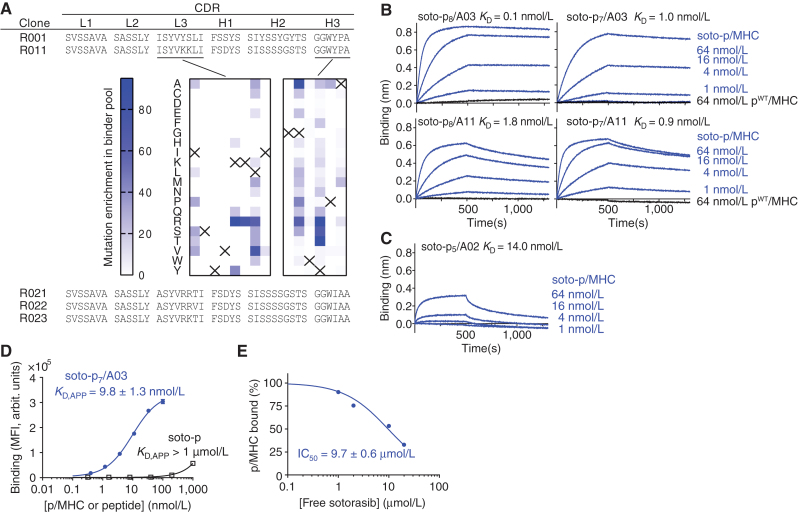
Development and binding properties of the R023 antibody. A, CDR sequences of R023 and its precursors and related clones. The middle images show the results of DMS of clone R011. The numbers indicate the total numbers of sequencing reads for each mutation, divided by the total number of reads for all mutations at the position, multiplied by 1,000. The crosses show the wild-type residue. B, BLI sensorgrams of the interaction between R023 Fab and the indicated MHC complexes. Biotinylated R023 Fab was immobilized, and binding of soluble p/MHC samples was measured. KD values from global fitting are shown. C, BLI sensorgrams of the interaction between R023 Fab and the soto-p5/A02 complex. D, Binding titration of scFv R023 displayed on the yeast cell surface to soto-p7/A03 (blue) and the soto-p7 conjugate in the absence of an MHC (open squares). arbit., arbitrary; MFI, median fluorescence intensity. E, Inhibition by free sotorasib of the interaction between soto-p7/A03 (10 nmol/L) and scFv R023 displayed on the yeast cell surface. The binding signal intensity was normalized using the value without sotorasib (100%) and in the absence of soto-p7/A03 (0%). IC50 values are reported ± standard error. In B and C, each data point shows the mean (n = 3; technical replicates) of the median fluorescence intensity. Error bars represent the standard deviation.