. 2022 Nov 10;13(1):41–55. doi: 10.1158/2159-8290.CD-22-0405

Figure 2.

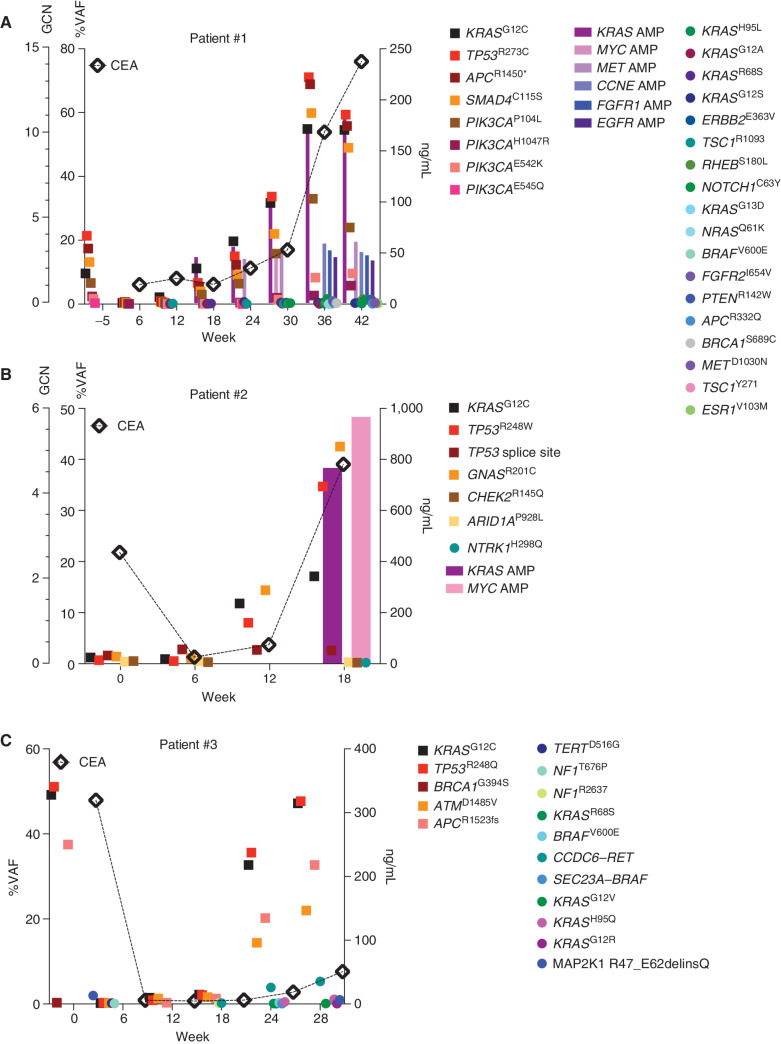
Longitudinal analysis of ctDNA in colorectal cancer patients on KRASG12C–EGFR inhibition. A–C, Patients with colorectal cancer treated with combined KRASG12C and EGFR inhibitors: circles indicate emergent alterations on treatment; bars indicate emergent copy-number changes; and tumor biomarker (CEA) is indicated with a diamond. In all graphs, KRASG12C is marked with solid black square and TP53 alterations are marked with a red square to track these truncal alterations. AMP, amplification; GCN, gene copy number.

Longitudinal analysis of ctDNA in colorectal cancer patients on KRASG12C–EGFR inhibition. A–C, Patients with colorectal cancer treated with combined KRASG12C and EGFR inhibitors: circles indicate emergent alterations on treatment; bars indicate emergent copy-number changes; and tumor biomarker (CEA) is indicated with a diamond. In all graphs, KRASG12C is marked with solid black square and TP53 alterations are marked with a red square to track these truncal alterations. AMP, amplification; GCN, gene copy number.