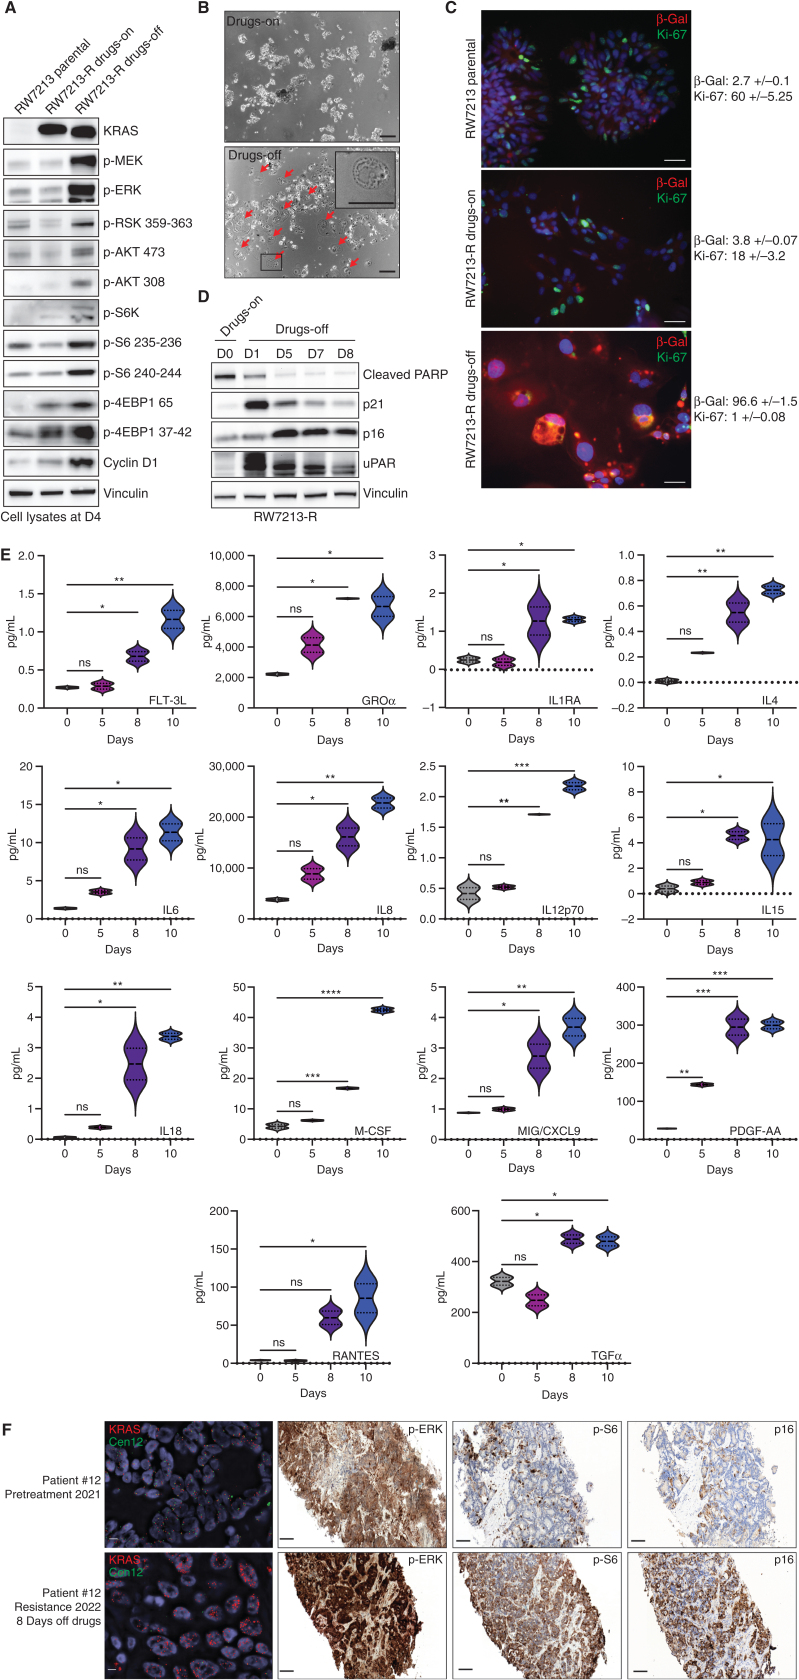
Figure 3.
Drug withdrawal drives the senescent phenotype in a resistant colorectal cancer cell line with acquired KRASG12C amplification. A, Western blot analyses of the effects on MAPK and mTOR pathway regulation in RW7213 parental cells and in RW7213 resistant cells (RW7213-R) with and without cetuximab–sotorasib combination; vinculin is included as a loading control. B, Microscopy images of RW7213-R with and without cetuximab–sotorasib combination: 10× magnification; scale bars, 100 μm. In the bottom left corner, the black square represents the area magnified in the upper-right corner inset. The red arrows indicate senescent cells. C, Ki-67 and β-galactosidase (β-Gal) staining by immunofluorescence (time point 4 days): 10× magnification; scale bars, 100 μm. Quantification represents the percentage of β-Gal– and Ki-67–positive cells per total number of cells; ± symbol indicates variation between pictures. Ten independent pictures have been quantified per condition. D, Western blot analyses of p16, p21, cleaved PARP, and uPAR expression upon drug withdrawal; vinculin is included as a loading control.E, SASP cytokine array time-course experiment. Data shown represent duplicates. Statistical analyses and P values represent two-way ANOVA with Dunnett multiple comparisons test. ns (not significant) = P > 0.05; *, P ≤ 0.05; **, P ≤ 0.01; ***, P ≤ 0.001; ****, P ≤ 0.0001.F, FISH staining for KRAS (scale bar, 5 μm) and IHC for p-ERK, p-S6 (S235), and p16 in tissue samples collected from patient 12, consisting of pretreatment liver metastasis biopsy (pretreatment 2021) and progression liver metastasis biopsy collected 8 days after stopping KRASG12C and EGFR inhibitors (resistance 2022). Mean KRAS (red)/Cen12 (green) ratio, based on manual counting of 50 cells from each time point, was 1.8 for the pretreatment specimen and 13.2 for the resistance specimen. p-ERK staining was 2+ involving >90% of cells pretreatment and 3+ involving >90% of cells at progression; p-S6 staining was absent pretreatment and 2+ involving 70% of cells at progression; and p16 staining was 2+ involving 5% of cells pretreatment and 2+ involving 65% of cells at progression. Magnification of all IHC slides is 20×; scale bars, 100 μm.

