. 2022 Nov 10;13(1):41–55. doi: 10.1158/2159-8290.CD-22-0405

Figure 4.

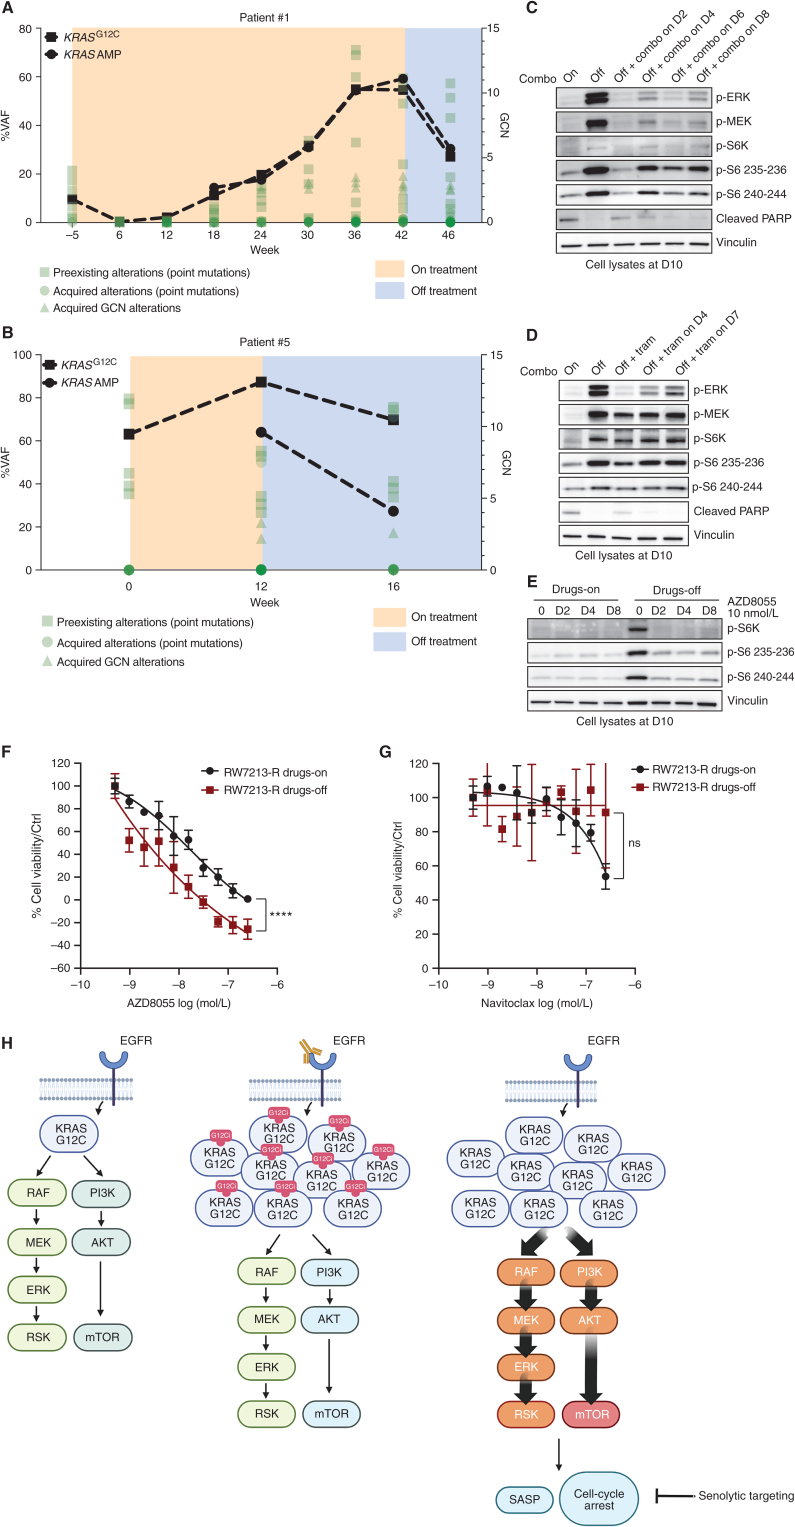
Figure 4. Effect of treatment withdrawal in resistant colorectal cancers with amplified KRASG12C. A, Longitudinal analysis of ctDNA in a colorectal cancer patient who held KRAS and EGFR inhibition for approximately 4 weeks after progression. B, Longitudinal analysis of ctDNA in a colorectal cancer patient who held KRAS and EGFR inhibition for approximately 4 weeks after progression. KRASG12C ctDNA variant allelic frequencies are marked with squares, and KRAS plasma copy numbers are marked with circles. All the other variants are reported in green. C, Western blot analyses of p-ERK, p-MEK, p-S6K, p-S6, and cleaved PARP expression upon drug withdrawal and rechallenge with cetuximab 50 μg/mL sotorasib 3 μmol/L combination; vinculin is included as a loading control. D, Western blot analyses of p-ERK, p-MEK, p-S6K, p-S6, and cleaved PARP expression upon drug withdrawal and rechallenge with 10 nmol/L trametinib; vinculin is included as a loading control. E, Western blot analyses of p-S6K and p-S6 upon drug withdrawal or in drug-containing medium after treatment with 10 nmol/L AZD8055; vinculin is included as a loading control. F, Short-term proliferation assay RW7213-R cells in medium containing cetuximab–sotorasib (black) and in senescent conditions (dark red). Cells were seeded in the absence or presence of drugs for 4 days and then treated for 96 hours with increasing concentration of AZD8055 and then ATP content was measured using CellTiter-Glo. Data represent the average and standard deviation of 3 biological replicates. G, Short-term proliferation assay RW7213-R cells in medium containing cetuximab–sotorasib (black) and in senescent conditions (dark red). Cells were seeded in the absence or presence of drugs for 4 days and then treated for 96 hours with increasing concentration of navitoclax and then ATP content was measured using CellTiter-Glo. Data represent the average and standard deviation of 3 biological replicates. H, Proposed model: KRASG12C mutant signaling is maintained at a similar level in parental cells and in resistant cells in the presence of concomitant EGFR and KRASG12C blockade. Upon drug removal, KRASG12C amplified signaling drives oncogene-induced senescence characterized by elevated mTOR activity creating a new steady state that may be targeted by senolytic treatments.

Effect of treatment withdrawal in resistant colorectal cancers with amplified KRASG12C. A and B, Longitudinal analysis of ctDNA in colorectal cancer patients who held KRAS and EGFR inhibition for approximately 4 weeks after progression. KRASG12C ctDNA VAFs are marked with squares, and KRAS plasma copy numbers are marked with circles. All the other variants are reported in green. AMP, amplification; GCN, gene copy number. C, Western blot analyses of p-ERK, p-MEK, p-S6K, p-S6, and cleaved PARP expression upon drug withdrawal and rechallenge with 50 μg/mL cetuximab and 3 μmol/L sotorasib combination; vinculin is included as a loading control. D, Western blot analyses of p-ERK, p-MEK, p-S6K, p-S6, and cleaved PARP expression upon drug withdrawal and rechallenge with 10 nmol/L trametinib (tram); vinculin is included as a loading control. E, Western blot analyses of p-S6K and p-S6 upon drug withdrawal or in drug-containing medium after treatment with 10 nmol/L AZD8055; vinculin is included as a loading control.F, Short-term proliferation assay of RW7213 resistant cells (RW7213-R) in medium containing cetuximab–sotorasib (black) and in senescent conditions (dark red). Cells were seeded in the absence or presence of drugs for 4 days and then treated for 96 hours with increasing concentrations of AZD8055, and then ATP content was measured using CellTiter-Glo. Data represent the average and standard deviation of 3 biological replicates. ns (not significant) = P > 0.05; ****, P ≤ 0.0001. G, Short-term proliferation assay of RW7213-R in medium containing cetuximab–sotorasib (black) and in senescent conditions (dark red). Cells were seeded in the absence or presence of drugs for 4 days and then treated for 96 hours with increasing concentration of navitoclax, and then ATP content was measured using CellTiter-Glo. Data represent the average and standard deviation of 3 biological replicates. H, Proposed model: KRASG12C mutant signaling is maintained at a similar level in parental cells and in resistant cells in the presence of concomitant EGFR and KRASG12C blockade. Upon drug removal, KRASG12C-amplified signaling drives oncogene-induced senescence characterized by elevated mTOR activity, creating a new steady state that may be targeted by senolytic treatments.