. 2022 Oct 20;13(1):146–169. doi: 10.1158/2159-8290.CD-22-0416

Figure 4.

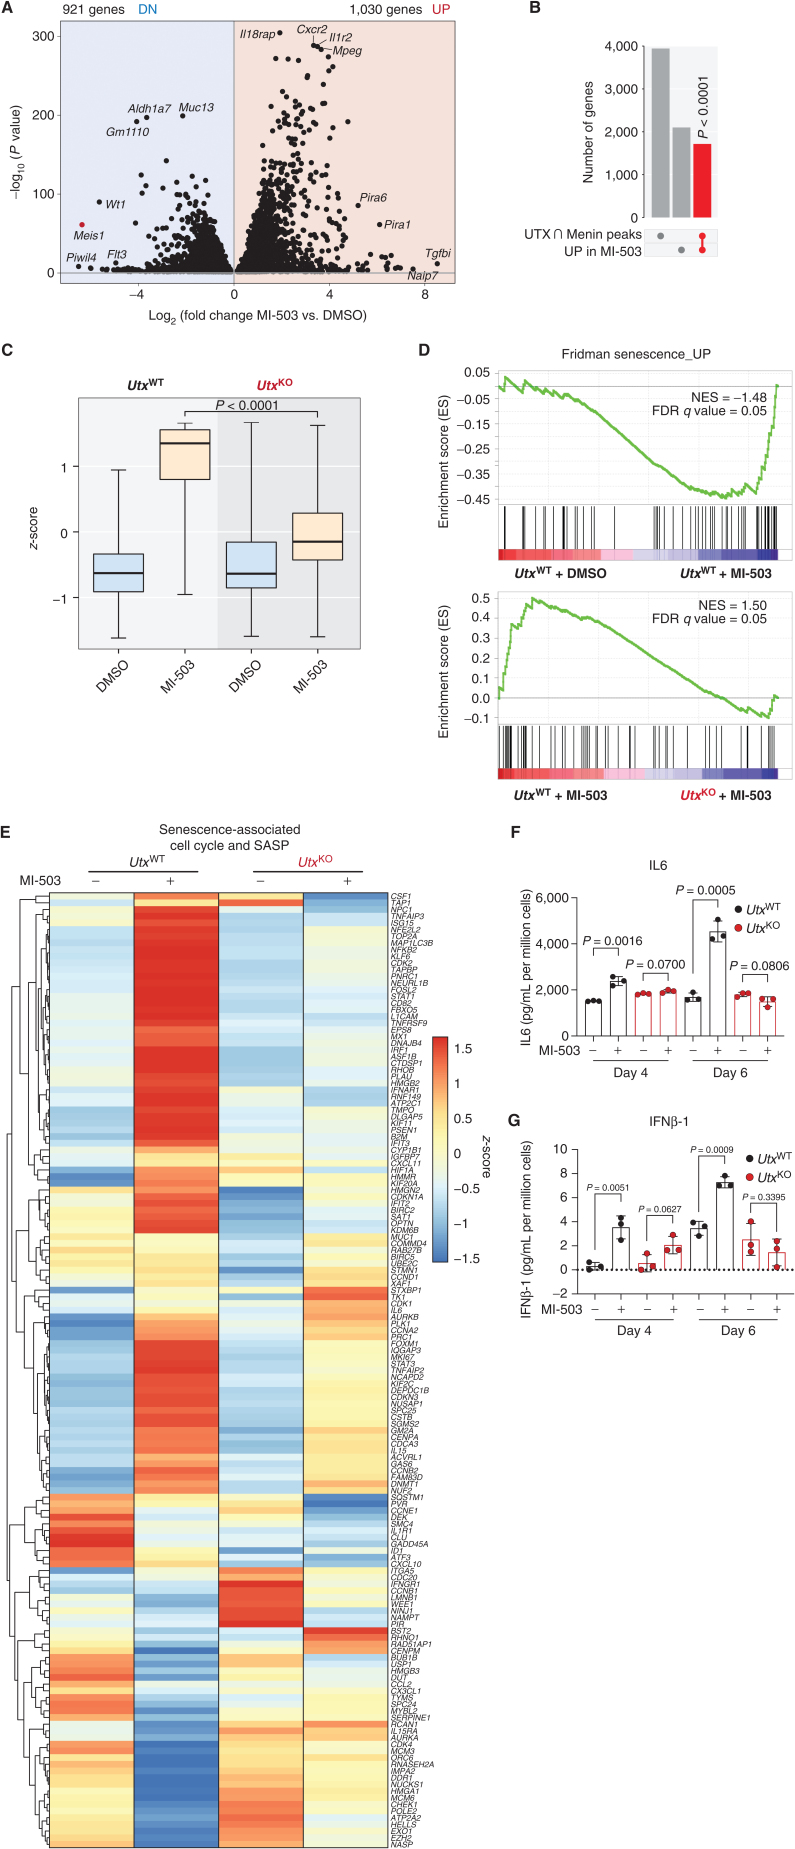
Figure 4. Transcriptional coregulation of tumor-suppressive pathways by the Menin–UTX switch. A, Volcano plot of differentially expressed genes in mouse MLL-AF9 leukemia cells treated with Menin inhibitor (MI-503) or vehicle (DMSO) for 96 hours. Significantly (P < 0.05) downregulated (DN) genes are shown on the left (n = 921 genes). Significantly (P < 0.05) upregulated (UP) genes are shown on the right (n = 1,030). B, Upset plot showing significant overlap (red) between genes that undergo replacement of Menin by UTX at their promoters and MI-503–induced genes. P value for overlap is shown. C, Boxplot showing expression levels of genes that are induced by Menin-MLL inhibitor (MI-503) treatment and are bound by UTX at their promoters in this condition and by Menin at steady state. Expression levels are shown for UtxWT and UtxKO leukemia cells. The midline in boxplots represents median. P value for MI-503 comparison is shown. D, GSEA showing that Menin–UTX targets induced by Menin-MLL inhibitor (MI-503) are significantly enriched for genes regulating cellular senescence. FDR, false discovery rate; NES, normalized enrichment score. E, Heat map showing relative gene-expression levels of senescence-associated cell-cycle and SASP genes in mouse UtxWT and UtxKO MLL-AF9 leukemia cells treated with Menin-MLL inhibitor (MI-503) or vehicle (DMSO) for 96 hours. F and G, Secreted levels of IL6 and IFNβ-1 in conditioned media derived from mouse UtxWT (black) and UtxKO (red) MLL-AF9 leukemia cells treated with Menin-MLL inhibitor (MI-503) or vehicle (DMSO) for 4 or 6 days. Data are quantified as pg/mL of secreted cytokine per million cells. Data are quantified as pg/mL of secreted cytokine per million cells (mean ± SEM, n = 3 replicates, P value calculated by Student t test).

Transcriptional coregulation of tumor-suppressive pathways by the Menin–UTX switch. A, Volcano plot of differentially expressed genes in mouse MLL-AF9 leukemia cells treated with a Menin–MLL inhibitor (MI-503) or vehicle (DMSO) for 96 hours. Significantly (P < 0.05) downregulated (DN) genes are shown on the left (n = 921 genes). Significantly (P < 0.05) upregulated (UP) genes are shown on the right (n = 1,030). B, Upset plot showing significant overlap (red) between genes that undergo replacement of Menin by UTX at their promoters and MI-503–induced genes. P value for overlap is shown. C, Box plot showing expression levels of genes that are induced by Menin–MLL inhibitor (MI-503) treatment and are bound by UTX at their promoters in this condition and by Menin at steady state. Expression levels are shown for UtxWT and UtxKO leukemia cells. The midline in box plots represents median. P value for MI-503 comparison is shown. D, GSEA showing that a Menin–UTX targets induced by a Menin–MLL inhibitor (MI-503) are significantly enriched for genes regulating cellular senescence. FDR, false discovery rate; NES, normalized enrichment score.E, Heat map showing relative gene expression levels of senescence-associated cell-cycle and senescence-associated secretory phenotype (SASP) genes in mouse UtxWT and UtxKO MLL-AF9 leukemia cells treated with a Menin–MLL inhibitor (MI-503) or vehicle (DMSO) for 96 hours. F and G, Secreted levels of IL6 and IFNβ-1 in conditioned media derived from mouse UtxWT (black) and UtxKO (red) MLL-AF9 leukemia cells treated with a Menin–MLL inhibitor (MI-503) or vehicle (DMSO) for 4 or 6 days. Data are quantified as pg/mL of secreted cytokine per million cells (mean ± SEM, n = 3 replicates, P values calculated by Student t test).