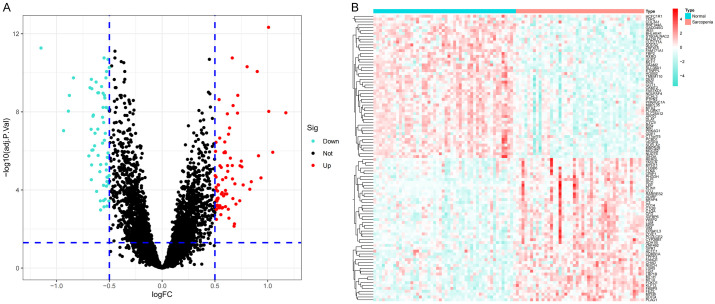
Figure 1.
A. Volcano plot of differentially expressed genes (DEGs). The red dots in the upper right part represent up-regulated DEGs. The blue dots in the upper left part represent down-regulated DEGs. The middle black dots represent the remaining stable genes. B. Heatmap of the top 100 DEGs. The colors from red to blue in the figure represent the expression of DEGs from high to low.

