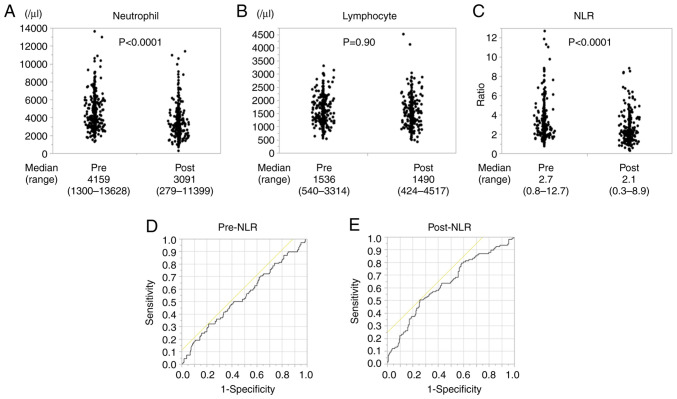
Figure 1.
(A) Numerical data for pre- and post-neutrophil count (n=338). (B) Numerical data of pre- and post-lymphocyte count (n=338). (C) Numerical data for pre- and post-NLR (n=338). (D) ROC curve analysis for the optimal cutoff pre-NLR value which discriminated between survival and death 3 years after operation. (E) ROC curve analysis for the optimal cutoff post-NLR value which discriminated between survival and death 3 years after operation. NLR, neutrophil-to-lymphocyte ratio; ROC, receiver operating characteristic.

