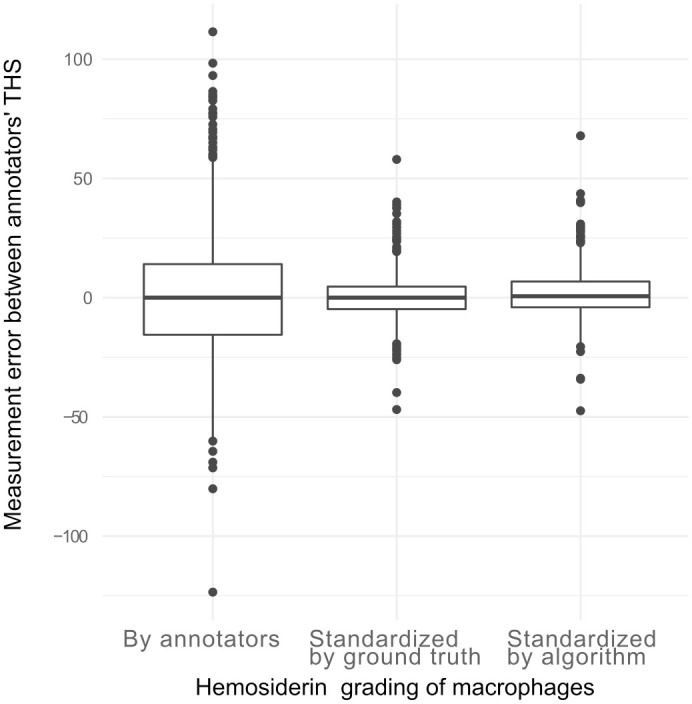
Figure 5.

Comparison of the total hemosiderin score (THS) differences of individual annotators to the mean THSs of all annotators. For the left box plot, the hemosiderin grade of each included macrophage was derived from the annotators’ annotations. The measurement error is derived to a large proportion from interobserver variability in hemosiderin grading (systematic error). For the middle and right box plots, the cells selected by the annotators were graded according to the hemosiderin label of the ground truth annotations (middle boxplot) or the algorithmic predictions (right boxplot), thereby eliminating the interobserver variability of hemosiderin grading.
