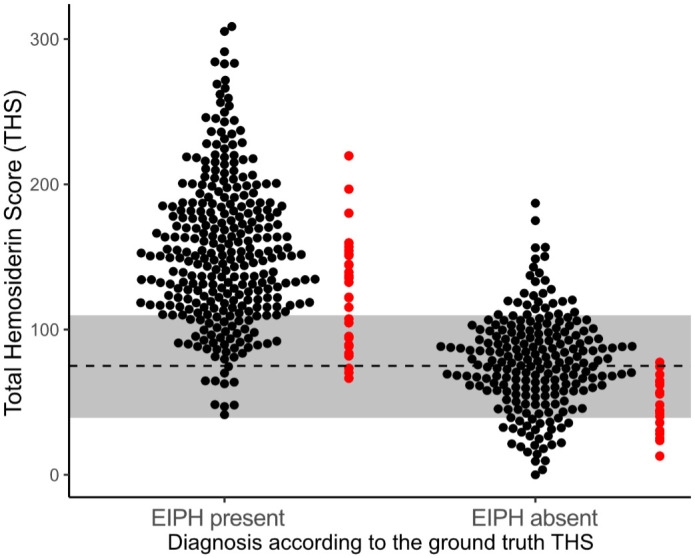
Figure 6.

Scatter plots for the total hemosiderin scores (THSs) determined by the 10 annotators (black dots) and deep learning-based algorithm (red dots). The 52 cases are separated based on the ground truth THS being above or below the diagnostic cut-off value of 75 indicated by the broken line. The gray bar around the broken line is the diagnostic 80% uncertainty interval determined for the human annotators in this study.
