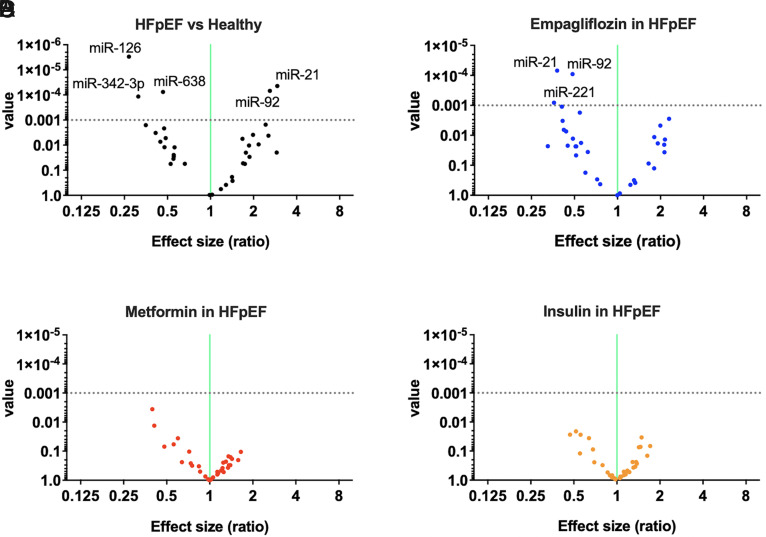
Fig. 2.
Volcano plots depicting the miR analyses in the different groups. (A) HFpEF versus healthy controls; (B) effects of empagliflozin treatment in HFpEF patients; (C) effects of metformin treatment in HFpEF patients; and (D) effects of insulin Ctreatment in HFpEF patients. The horizontal dotted line represents a P value of 0.001; thus, the points in the plot above that line represent the differently expressed miRs with statistical significance.

