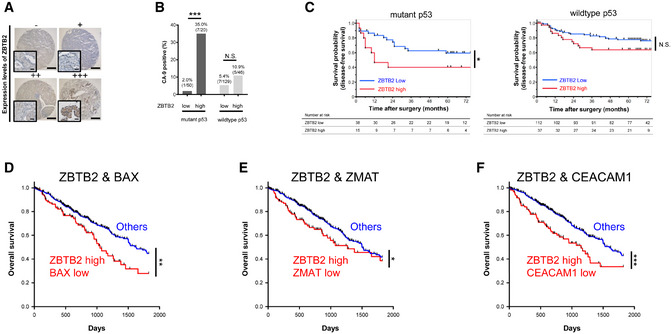
Figure 3. ZBTB2 expression is associated with poor prognoses in patients with p53‐deficient cancers.

-
ATissue microarrays of human lung adenocarcinoma (243 samples) stained with anti‐ZBTB2 antibodies. High‐magnification images are shown on the left lower side of each image. Scale bar, 500 and 100 μm in the low‐ and high‐magnification images, respectively.
-
BFisher's exact test for the percentage of CA9‐positive tumors in the four indicated groups. Percentages and absolute numbers of each group are indicated in the graph.
-
CKaplan–Meier analysis of the disease‐free survival of the lung cancer patients stratified by the expression levels of ZBTB2 and p53 status.
-
D–FTCGA‐based Kaplan–Meier analysis of overall survival of lung adenocarcinoma patients stratified by the expression levels of ZBTB2 and those of BAX (D), ZMAT3 (E), and CEACAM1 (F).
Data information: N.S., not significant, *P < 0.05, **P < 0.01, ***P < 0.001, Fisher's exact test (B) and log‐rank tests (C–F).
Source data are available online for this figure.
