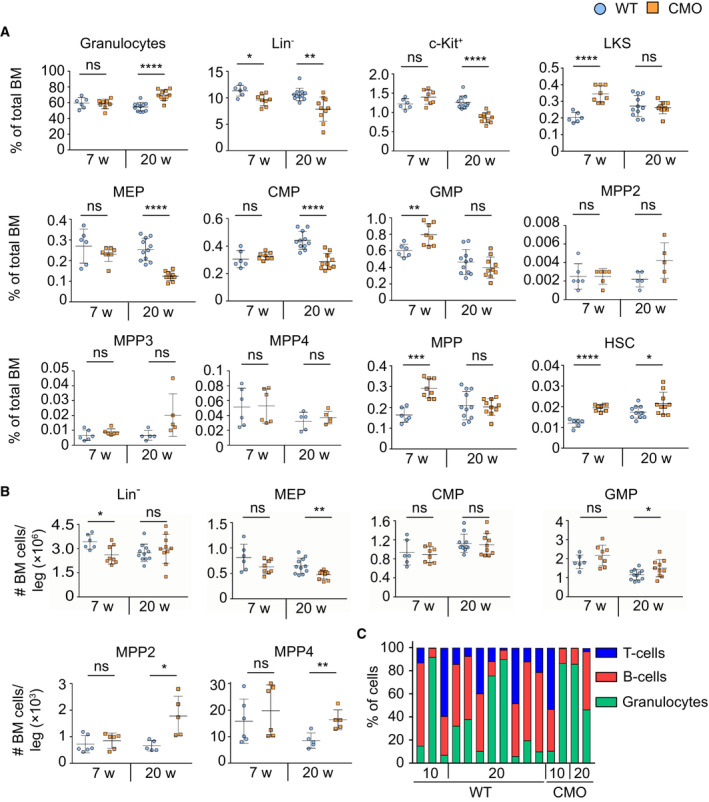
Figure EV1. CMO BM exhibits increased cellularity and expansion of HSPCs in a time‐dependent fashion.

-
A, BPercentage (A) and absolute number (B) of distinct BM subpopulations. Each symbol represents one biological replicate (mouse). Blue round symbols indicate values for WT mice and square orange symbols indicate values for CMO mice. X‐axes indicate the age of the mice: 7 or 20 weeks old (w). Data represent mean ± s.d. At least six mice were used per group in two separate experiments. Statistical significance was assessed using two‐tailed Student's t‐tests (*P < 0.05, **P < 0.01, ***P < 0.001, ****P < 0.0001, ns, not significant).
-
CTri‐lineage reconstitution upon transplantation of WT and CMO HSCs. The x‐axis indicates the dose of donor cells. The y‐axis indicates the percentage of cells defined as Gr1+ CD11b+ myeloid cells (green), B220+ B‐cells (red), and CD3+ T‐cells (blue). Each column represents values for one mouse.
