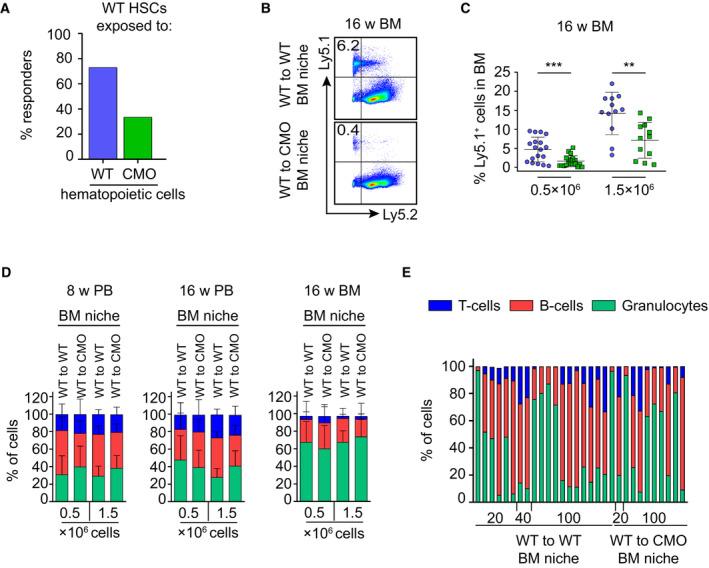
Percentage of responder recipient mice that received WT HSCs, which co‐habited with WT or CMO hematopoietic cells. A recipient was considered as a positive responder when engraftment was ≥ 0.01% Ly5.1+ cells and contribution ≥ 0.5% in at least one out of three lineages (granulocytes, B‐cells, and T‐cells) at week 16 post‐transplantation. Percentage of Ly5.1+ donor‐derived cells in blood of secondary recipients.
Representative flow cytometry plots from secondary recipient mice transplanted with 0.5 × 10⁶ WT BM exposed to WT (WT to WT) or CMO (WT to CMO) BM niche. Y‐axis shows Ly5.1+ cells and x‐axis Ly5.2+ cells in BM of recipient mice 16 weeks after transplantation. Numbers indicate the percentage of WT donor‐derived Ly5.1+ cells.
Quantification of panel (B). X‐axis indicates the dose of transplanted cells. At least 12 animals were used per group in three separate experiments. Values for WT BM exposed to WT BM niche are indicated with a blue symbol, and values for WT BM exposed to CMO BM niche are indicated in a green symbol. Each symbol represents one biological replicate (mouse). Data represent mean ± s.d. Statistical significance was assessed using two‐tailed Student's t‐tests (**P < 0.01, ***P < 0.001).
Tri‐lineage reconstitution from secondary transplantation of WT BM exposed to WT (WT to WT) or CMO (WT to CMO) BM niche. Graphics indicate analysis of peripheral blood (PB) 8 and 16 weeks after transplantation, and BM 16 weeks after transplantation. Each column indicates mean ± s.d. (at least 12 mice were used per group in three separate experiments). Y‐axes indicate the percentage of donor‐derived Ly5.1+ Gr1+ CD11b+ granulocytes (green), B220+ B‐cells (red), and CD3+ T‐cells (blue). The x‐axes indicate the number of donor cells.
Tri‐lineage reconstitution 16 weeks after transplantation in blood from secondary recipients transplanted with WT HSCs exposed to WT (WT to WT) or CMO (WT to CMO) BM niche. Each column represents values for one biological replicate (mouse). Y‐axes indicate the percentage of donor‐derived Ly5.1+ Gr1+ CD11b+ granulocytes (green), B220+ B‐cells (red), and CD3+ T‐cells (blue). The x‐axes indicate the number of donor cells.

