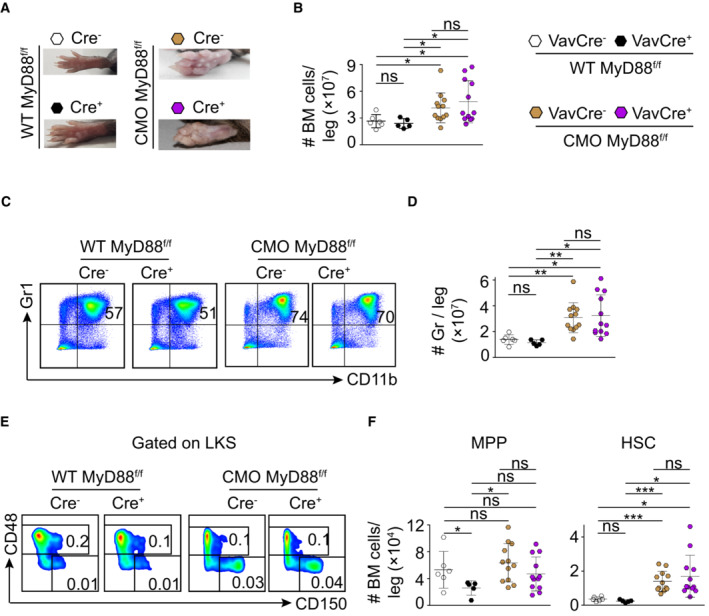
Figure 3. CMO mice lacking MyD88 in hematopoietic cells retain HSC expansion in BM.

- Picture of representative paws from WT MyD88flox/flox VAV‐iCre− (white symbol), WT MyD88flox/flox VAV‐iCre+ (black symbol), CMO MyD88flox/flox VAV‐iCre− (brown symbol), and CMO MyD88flox/flox VAV‐iCre+ (purple symbol) mice.
- Absolute number of BM cells per leg.
- Representative flow cytometry plots from BM cells isolated from the indicated mouse genotypes. Y‐axes indicate Gr1 expression and x‐axes CD11b expression. Numbers indicate the percentage of Gr1+ CD11b+ granulocytes.
- Quantification of the absolute number of granulocytes per leg.
- Representative flow cytometry plots from indicated mouse genotypes. Y‐axes indicate CD48 expression and x‐axes CD150 expression in the LKS population. Numbers indicate the percentage of MPPs (upper box) and HSCs (lower box) in total BM.
- Quantification of the absolute number of MPPs and HSCs per leg. Y‐axes indicate the number of MPPs (left panel) and HSCs (right panel) per leg.
Data information: In this figure, each symbol indicates values for one biological replicate (mouse). At least five mice were used per group in two separate experiments. Data represent mean ± s.d. Statistical significance was assessed using two‐tailed Student's t‐tests (*P < 0.05, **P < 0.01, ***P < 0.001, ns, not significant).
