-
A
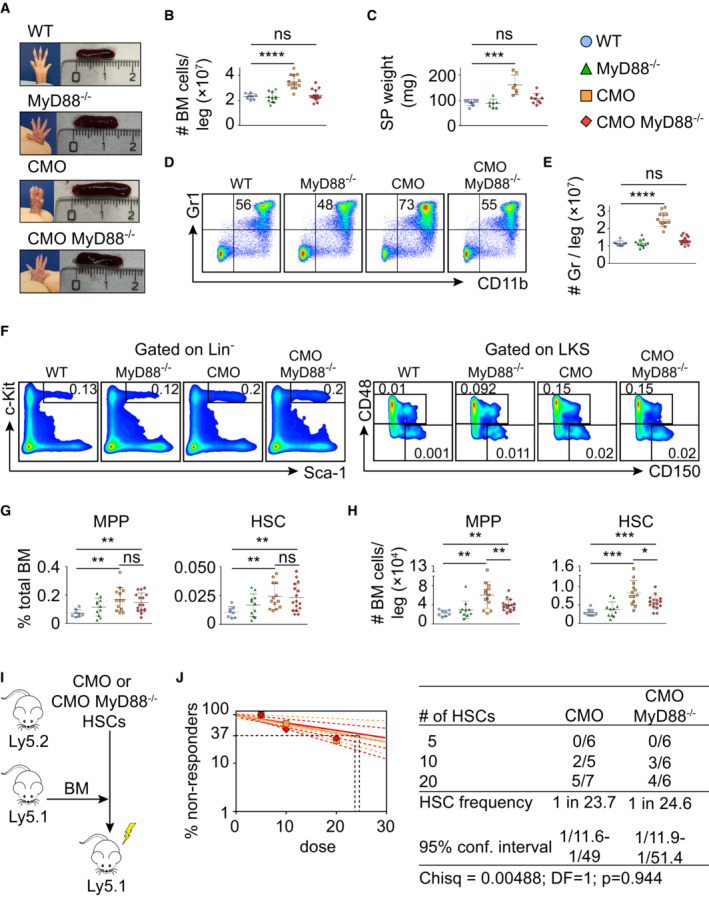
Representative paw and spleen pictures from each experimental group: WT, MyD88−/−, CMO, and CMO/MyD88−/− mice.
-
B
Absolute number of BM cells per leg. Each symbol represents a biological replicate (mouse). At least eight mice were used per group in two separate experiments. Data represent mean ± s.d. Statistical significance was assessed using two‐tailed Student's t‐tests (****P < 0.0001, ns, not significant).
-
C
Spleen weight (mg). Each symbol indicates values for one biological replicate (mouse). At least seven mice were used per group in two separate experiments. Data represent mean ± s.d. Statistical significance was assessed using two‐tailed Student's t‐tests (***P < 0.001, ns, not significant).
-
D
Representative flow cytometry plots from WT, MyD88−/−, CMO, and CMO/MyD88−/− mice. Plots illustrate the expression of Gr1 (Y‐axes) and CD11b (X‐axes) in BM. Numbers indicate the percentage of Gr1+ CD11b+ granulocytes.
-
E
Quantification of the absolute number of granulocytes per leg. Each symbol indicates values for one biological replicate (mouse). At least eight mice were used per group in three separate experiments. Data represent mean ± s.d. Statistical significance was assessed using two‐tailed Student's t‐tests (****P < 0.0001, ns, not significant).
-
F
Representative flow cytometry plots from WT, MyD88−/−, CMO, and CMO/MyD88−/− mice. Left panels: Y‐axes indicate c‐Kit expression and x‐axes Sca‐1 expression in lineage− cells. Box indicates LKS population. Right panels: y‐axes indicate CD48 expression and x‐axes CD150 expression in the LKS population. Boxes represent MPPs (upper box), and HSCs (lower box). Numbers indicate the percentage of total BM.
-
G, H
Percentage (G) and absolute number (H) of MPPs and HSCs per leg. Blue symbols indicate WT, green MyD88−/−, orange CMO, and red CMO/MyD88−/− double‐mutant mice. Each symbol represents a 20‐week‐old mouse (biological replicates). At least eight mice were used per group in three separate experiments. Data represent mean ± s.d. Statistical significance was assessed using two‐tailed Student's t‐tests (*P < 0.05, **P < 0.01, ***P < 0.001, ns, not significant).
-
I
Transplantation scheme of CMO and CMO MyD88−/− HSCs.
-
J
Frequency of functional CMO (orange) and CMO MyD88−/− (red) HSCs measured by limiting dilution competitive repopulation unit assays and calculated using ELDA online software based on Poisson distribution statistics (Chi‐square test; Chisq = 0.00488; P = 0.944). Graph shows the curve fit of the log fraction of nonresponding mice (solid lines) and confidence intervals (dashed lines) versus the number of mice tested. Logarithmic plot; X‐axis indicates the dose of transplanted cells and Y‐axis percentages of negative responders. Reconstitution was evaluated in blood of recipient mice 16 weeks after transplantation. A responder mouse was defined as engraftment ≥ 0.5% Ly5.2+ cells and contribution ≥ 0.5% in at least two out of three lineages (granulocytes, B‐cells, and T‐cells).

