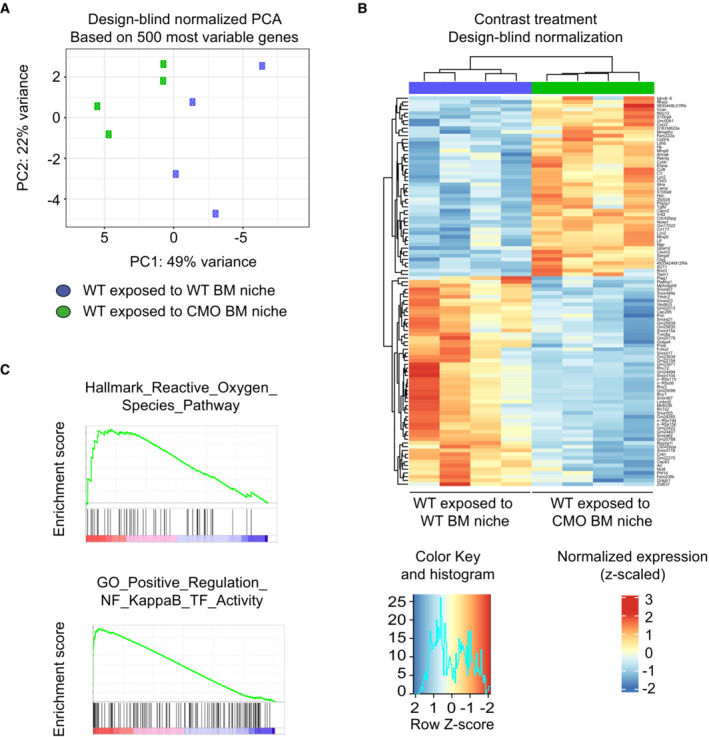
Figure EV4. RNA‐seq analysis of WT HSCs exposed to WT recipient mice (WT exposed to WT BM niche) or WT HSC exposed to CMO recipient mice (WT exposed to CMO BM niche).

-
APrincipal component analysis of four samples of WT HSC exposed to WT recipient mice (WT exposed to WT BM niche, blue symbols) and four samples of WT HSC exposed to CMO recipient mice (WT exposed to CMO BM niche, green symbols).
-
BHeatmap of unsupervised hierarchical cluster analysis of genes differentially expressed in WT HSC exposed to WT or CMO recipient mice (P < 0.05, log2 fold change > 0.5). Data is normalized to z‐scores for each gene. Red color indicates increased and blue color decreased gene expression in comparison to the universal mean for each gene.
-
CRepresentative enrichment plots showing upregulated pathways in WT HSC exposed to CMO recipient mice from MSigDB Hallmark gene set v.7 and MSigDB GO Biological Process gene set v.7.
