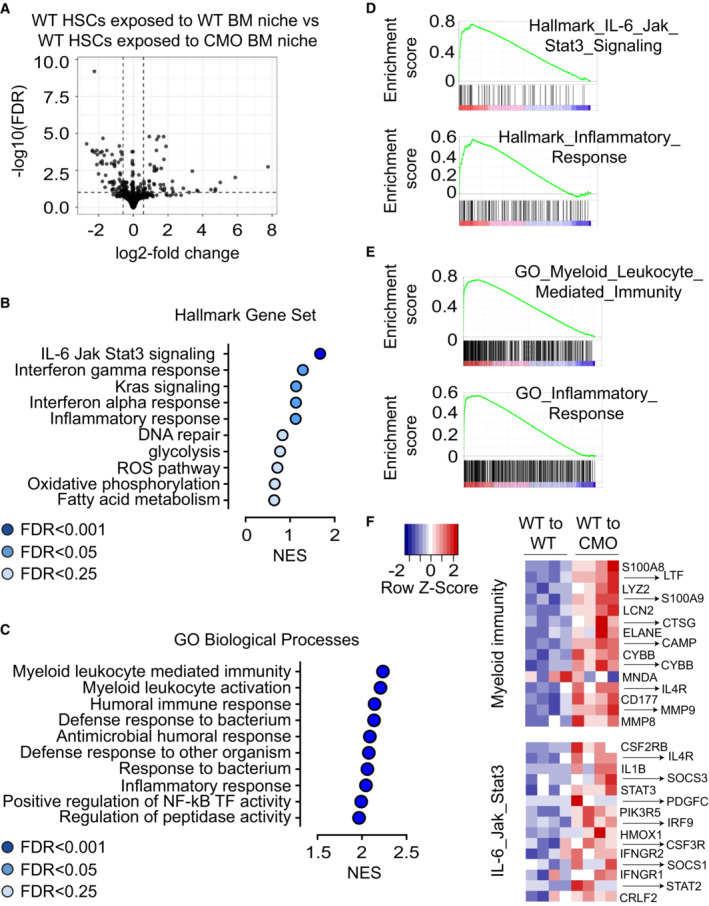
Figure 5. CMO BM niche induces activation of pathways involved in myeloid differentiation and inflammation in HSCs.

-
AVolcano plot showing the differentially expressed genes in WT HSCs exposed to WT BM niche compared with WT HSCs exposed to CMO BM niche.
-
B, CGene Set Enrichment Analysis (GSEA) showing top relevant pathways upregulated in WT HSCs exposed to CMO BM niche compared with WT HSCs exposed to WT BM niche. Data were generated using (B) MSigBD Hallmark gene set v.7 (ranked according to NES values, FDR < 0.25) and (C) and MSigDB GO Biological Processes gene set v.7 (ranked according to NES values, FDR < 0.00001).
-
D, ERepresentative enrichment plots showing (D) two upregulated pathways in WT HSC exposed to CMO recipient mice from MSigDB Hallmark gene set v.7 and (E) two from MSigDB GO Biological Process gene set v.7.
-
FHeatmaps of unsupervised hierarchical cluster analysis of the top 15 genes differentially expressed in the Hallmark myeloid immunity signature (upper heatmap) and top 15 genes differentially expressed in the GO IL‐6/Jak/Stat3 signaling pathway (lower heatmap) in WT HSC exposed to WT or CMO recipient mice (P < 0.05, log2 fold change > 0.5). Data is normalized to z‐scores for each gene. Red color indicates increased and blue color decreased gene expression in comparison to the universal mean for each gene.
