-
A
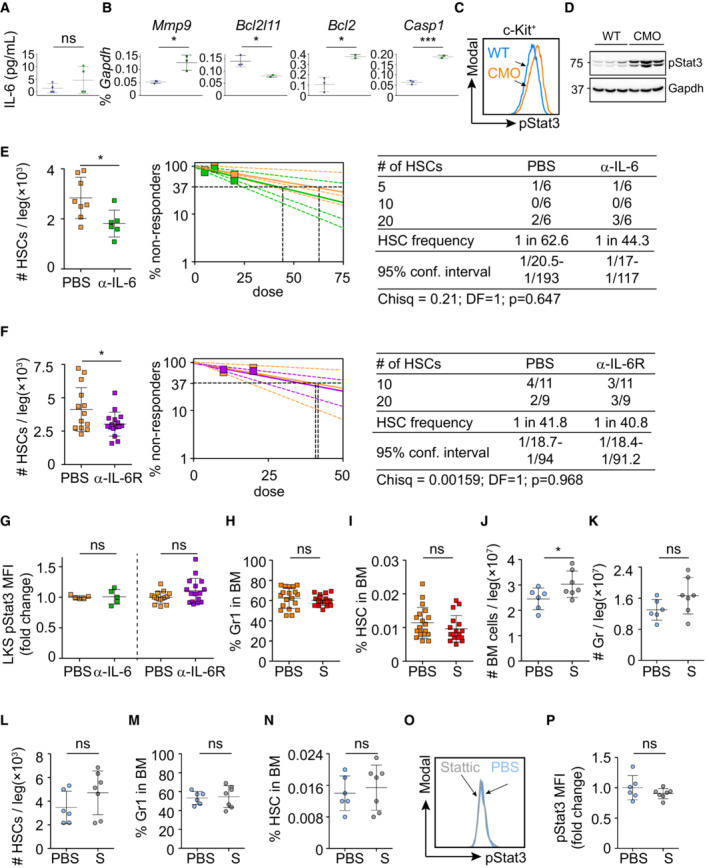
IL‐6 levels in BM of WT (n = 4) and CMO (n = 4) recipient mice upon transplantation of WT BM cells. Y‐axis indicates the amount of IL‐6 (pg/ml).
-
B
Quantitative RT–PCR in WT LKS cells exposed to WT (blue symbols) or CMO (green symbols) BM niche. The y‐axes represent Mmp9, Bcl2l11, Bcl2, and Casp1 expression relative to Gapdh.
-
C
Representative flow cytometry histograms of pStat3 signal from WT (blue) and CMO (orange) c‐Kit+ cells.
-
D
Western blot analysis for pStat3 in WT and CMO c‐Kit+ cells. Gapdh expression was used as a loading control. Positions of m.w. standards are indicated (KDa). (E and F right panels) HSCs are measured by limiting dilution competitive repopulation unit assays and calculated using ELDA online software based on Poisson distribution statistics. Graphs show the curve fit of the log fraction of nonresponding mice (solid lines) and confidence intervals (dashed lines) versus the number of mice tested. Logarithmic plot; X‐axis indicates the dose of transplanted cells and Y‐axis percentages of negative responders. Reconstitution was evaluated in blood of recipient mice 16 weeks after transplantation. A responder mouse was defined as engraftment ≥ 0.5% Ly5.2+ cells and contribution ≥ 0.5% in at least two out of three lineages (granulocytes, B‐cells, and T‐cells).
-
E
Number of phenotypically enumerated HSCs per leg (left panel) and frequency of functional HSCs (right panel) in CMO mice treated with PBS control (orange) or IL‐6‐blocking antibody (green).
-
F
Number of phenotypically enumerated HSCs per leg (left panel) and frequency of functional HSCs (right panel) in CMO mice treated with PBS control (orange) or IL‐6 receptor‐blocking compound (purple).
-
G
pStat3 levels in LKS cells isolated from CMO mice treated as indicated. Y‐axis indicates pStat3 mean fluorescence intensity (MFI). Values are normalized to the average of PBS treatment.
-
H, I
Percentage of granulocytes (H) and HSCs (I) in BM of CMO mice treated with PBS control or Stattic.
-
J–L
Absolute number of cells (J), granulocytes (K), and HSCs (L) per leg isolated from WT mice treated with PBS control (blue) or Stattic (S; gray).
-
M, N
Percentage of granulocytes (M) and HSCs (N) in BM isolated from WT mice treated with PBS control (blue) or Stattic (S; gray).
-
O
Representative flow cytometry histograms of pStat3 signal in LKS cells from WT mice treated with PBS control (blue) or Stattic (gray).
-
P
Quantification of panel (K). Y‐axis indicates pStat3 mean fluorescence intensity (MFI). Values are normalized to the average of the WT. In this figure, each symbol represents value for one biological replicate. Data represent mean ± s.d. Unless otherwise indicated, statistical significance was assessed using two‐tailed Student's t‐tests (*P < 0.05, ns, not significant).

