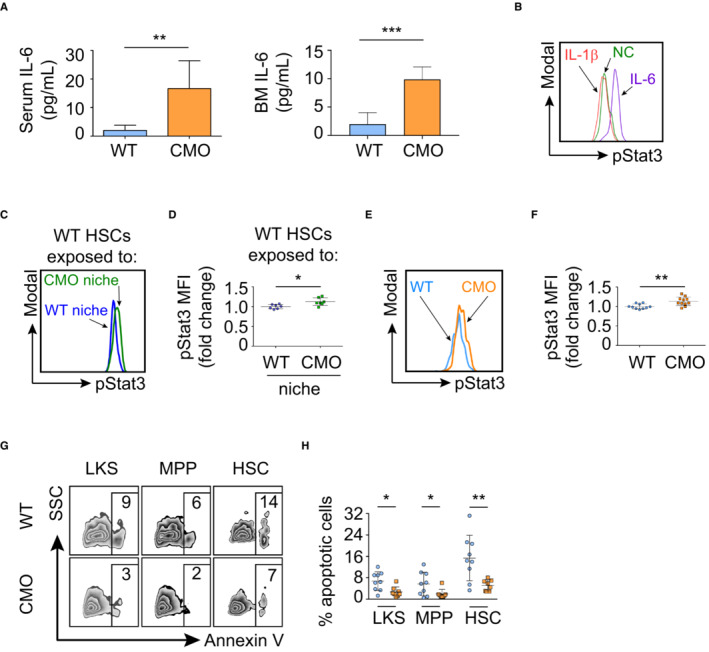
Figure 6. CMO HSCs exhibit increased IL‐6/Jak/Stat3 signaling and reduced apoptosis.

-
AIL‐6 levels in serum and BM of WT (n = 6) and CMO (n = 8) symptomatic mice. Y‐axis indicates the amount of IL‐6 (pg/ml). Data represent mean ± s.d.
-
BRepresentative flow cytometry histograms of pStat3 signal in WT HSCs stimulated with IL‐1β (red), IL‐6 (purple), or nonstimulated control (NC, green).
-
CRepresentative flow cytometry histograms of pStat3 signal from WT HSCs exposed to WT (blue) or to CMO (green) niche.
-
DQuantification of panel (C). Y‐axis indicates pStat3 mean fluorescence intensity (MFI). Values are normalized to the average of the WT. Each symbol indicates values for one biological replicate (mouse). At least seven mice were used per group in three separate experiments. Data represent mean ± s.d.
-
ERepresentative flow cytometry histograms of pStat3 signal from WT (blue) and CMO (orange) HSCs.
-
FQuantification of panel (E). Y‐axis indicates pStat3 mean fluorescence intensity (MFI). Values are normalized to the average of the WT. Each symbol represents one biological replicate, either a WT mouse (blue) or a CMO mouse (orange). At least 10 mice were used per group in three separate experiments. Data represent mean ± s.d.
-
GRepresentative flow cytometry plots from WT (upper plots) and CMO (lower plots) BM cells. Numbers indicate the percentage of Annexin V+ cells in distinct BM populations.
-
HQuantification of panel (G). Y‐axis indicates the percentage of Annexin V+ cells and x‐axis the distinct BM subpopulations. Each symbol represents one biological replicate (WT mice in blue and CMO mice in orange). At least eight mice were used per group in three separate experiments. Data represent mean ± s.d.
Data information: In this figure, statistical significance was assessed using two‐tailed Student's t‐tests (*P < 0.05, **P < 0.01, ***P < 0.001).
