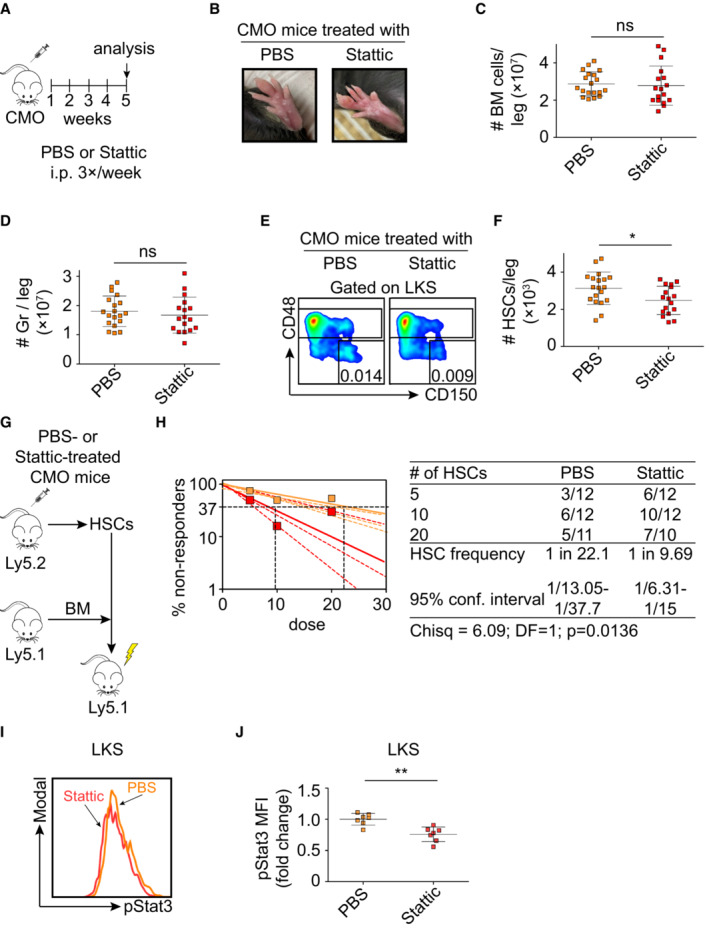
Figure 7. Stat3 inhibition prevents the expansion of CMO HSCs and rescues HSC fitness.

-
AScheme of Stattic treatment.
-
BPictures of representative paws from CMO mice treated with PBS control or Stattic. Pictures were taken on the last day of the experiment before sacrificing the mice.
-
C, DAbsolute number of BM cells (C) and granulocytes (D) in CMO mice. Y‐axes indicate the number of cells per leg. X‐axes indicate PBS (orange) or Stattic treatment (red). Each symbol indicates values for one biological replicate (mouse). At least 17 mice were used per group in three separate experiments. Data represent mean ± s.d.
-
ERepresentative flow cytometry plots from PBS‐ (left plot) and Stattic‐treated (right plot) CMO mice.
-
FQuantification of the absolute number of HSCs per leg. Each symbol represents one biological replicate (PBS‐treated CMO mouse, orange, and Stattic‐treated CMO mouse, red). Data represent mean ± s.d. At least 17 mice were used per group in three separate experiments.
-
GSchematic representation of the experimental design.
-
HFrequency of functional HSCs in CMO mice after treatment with Static (red) or PBS control (orange). Graph shows the curve fit of the log fraction of nonresponding mice (solid lines) and confidence intervals (dashed lines) versus the number of mice tested. Logarithmic plot shows the percentage of nonresponder recipient mice. Responders exhibited engraftment of ≥ 0.5% Ly5.1+ cells and contribution ≥ 0.5% in at least two out of three lineages (granulocytes, B‐cells, and T‐cells) at week 16 post‐transplantation. X‐axis indicates the dose of transplanted cells. Right table shows the number of responders and the total number of recipients transplanted per cell dose. Frequencies of HSCs were calculated using ELDA online software based on Poisson distribution statistics (Chi‐square test; Chisq = 6.09; P = 0.0136).
-
IRepresentative flow cytometry histograms of pStat3 signal from PBS‐ or Stattic‐treated CMO mice.
-
JQuantification of panel (I). Y‐axis indicates pStat3 mean fluorescence intensity (MFI). Values are normalized to the average of the PBS‐treated CMO mice. Each symbol represents values for a biological replicate (mouse). At least seven mice were used per group in two separate experiments. Data represent mean ± s.d.
Data information: In this figure statistical significance was assessed using two‐tailed Student's t‐tests (*P < 0.05, **P < 0.01, ns, not significant), unless otherwise indicated.
