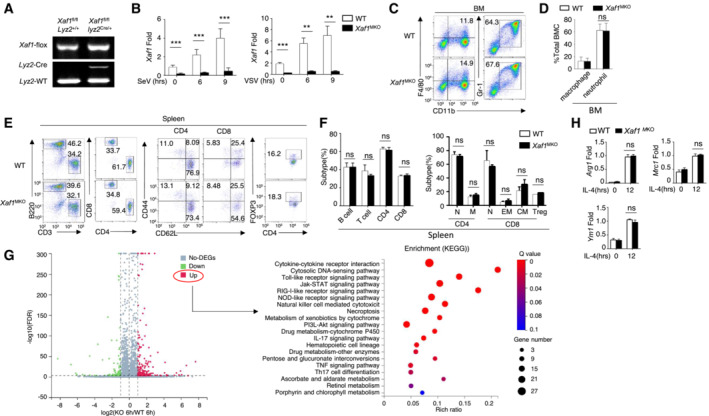
Figure EV1. XAF1 deficiency in myeloid cells had no effect on the development of peripheral immune cells.

-
AGenotyping PCR of WT (XAF1fl/flLyz2+/+) and myeloid‐conditional XAF1‐KO (XAF1MKO, XAF1fl/flLyz2+/Cre) mice.
-
BqRT–PCR analysis showing clear ablation of XAF1 in the BMDMs of XAF1MKO mice.
-
C, DFlow cytometry analysis of macrophages (CD11b+F4/80+) and neutrophils (CD11b+Ly6G+) in bone marrow (BM) from 6‐ to 8‐week‐old WT and XAF1MKO mice (n = 3).
-
E, FFlow cytometry analysis of the frequencies of distinct immune cells in the spleen (left), naïve and memory T cells (middle), and Treg cells (right) from WT or XAF1MKO mice (n = 3).
-
GVolcano plot illustrating the upregulated and downregulated DEGs in XAF1‐deficient BMDMs compared with WT littermates after 6 h of LPS stimulation. The KEGG analysis showed that the upregulated DEGs were enriched in biological processes.
-
HqRT–PCR analysis of ARG1, MRC1, and YM1 in IL‐4‐treated M2 macrophages in WT and XAF1‐deficient BMDMs.
Data information: All data are representative of at least three biologically independent experiments. Data from the qPCR assay are presented as the fold change relative to the Actin mRNA level. Data are represented as the means ± SDs. The significance of differences was determined by a t‐test. ns, not significant.
