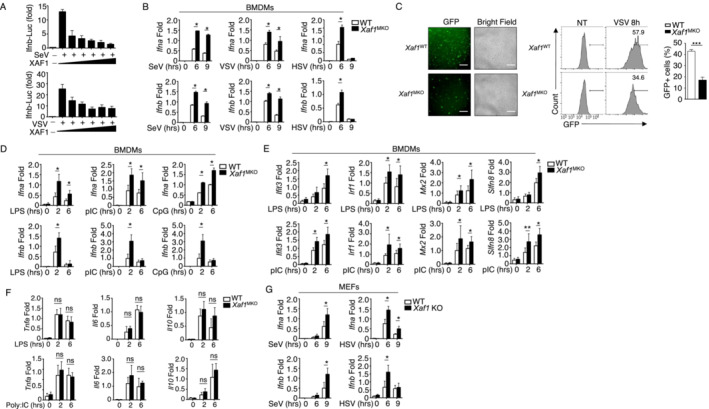
Figure 2. XAF1 negatively regulates IFN‐I induction.

- HEK293T cells were transfected with IFN‐β luciferase reporters and XAF1‐expressing plasmids and stimulated with SeV or VSV‐WT (MOI = 1). The readouts were normalized to Renilla luciferase activity and are presented as the fold change relative to activity in untransfected cells.
- qRT–PCR analysis of IFN‐I induction in WT and XAF1‐deficient BMDMs stimulated with different viruses.
- WT or XAF1‐deficient BMDMs were infected with GFP‐expressing VSV (VSV‐GFP) at an MOI of 0.1 for 8 h. The data are presented as representative images and FACS data, showing the infected (GFP+) and total (bright field) cells. Scale bar, 1,000 μm.
- qRT–PCR analysis of the mRNA levels of IFN‐I in WT and XAF1‐deficient BMDMs stimulated with distinct TLR agonists.
- Some of the LPS‐ or polyI:C‐induced ISGs in WT and XAF1‐deficient BMDMs were measured by qPCR.
- mRNA levels of the indicated cytokines in WT and XAF1‐deficient BMDMs activated by distinct TLR agonists.
- IFN‐I expression in WT and XAF1‐KO MEFs stimulated with SeV or HSV, evaluated by qPCR.
Data information: All data are representative of at least three biologically independent experiments. Data from the qPCR assay are presented as the fold change relative to the Actin mRNA level. The data are presented as the means ± SDs. The significance of differences was determined by t‐tests. *P < 0.05, **P < 0.01, and ***P < 0.005.
