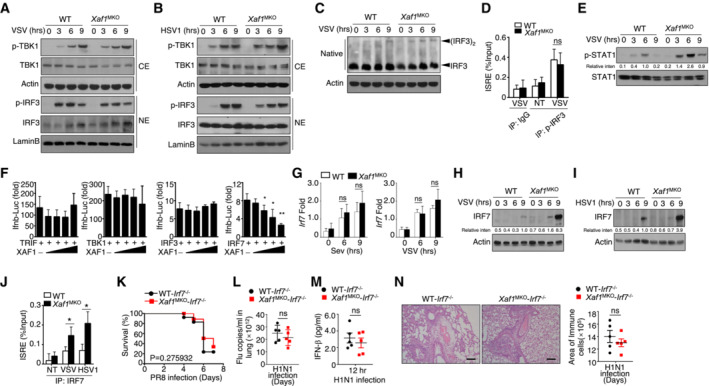
Figure 4. XAF1 regulates IRF7 stability.

-
A, BVirus‐induced phosphorylation of TBK1 and IRF3 in cytoplasmic (CE) and nuclear (NE) extracts of WT and XAF1‐deficient BMDMs was measured by IB.
-
CMonomeric and dimeric IRF3 expression (top blot) in whole‐cell lysates of WT and XAF1‐deficient BMDMs stimulated with VSV‐WT (MOI = 1) was measured by IB.
-
DChIP assays were performed, and the results were quantified by qRT–PCR to detect IRF3 binding to an ISRE in WT and XAF1‐deficient BMDMs activated by VSV‐WT (MOI = 1) for 9 h.
-
EIB was performed to determine the VSV‐induced phosphorylation level of STAT1.
-
FHEK293T cells were transfected with IFN‐β luciferase reporters in the presence (+) or absence (−) of the indicated XAF1 expression plasmids. Luciferase assays were used to determine the fold change in expression with respect to the empty vector group 36 h after transfection.
-
GqRT–PCR analysis of Irf7 mRNA in WT and XAF1‐deficient BMDMs stimulated with distinct virus infections.
-
H, IIB analysis of VSV‐ or HSV‐1‐induced IRF7 expression as measured in whole‐cell lysates of WT and XAF1‐deficient BMDMs.
-
JChIP assays were performed and quantified by qRT–PCR to detect IRF7 binding to an ISRE in WT and XAF1‐deficient BMDMs stimulated with VSV‐WT (MOI = 1) or HSV‐1.
-
K–NWT and XAF1MKO mice crossed with mice with an IRF7−/− background were i.n. infected with a sublethal dose (0.1 hyaluronic acid [HA]) of the H1N1 strain PR8. The survival rate (K, n = 15), viral titer in the lung (L, n = 5), serum IFN‐β level (M, n = 5), and intensity of H&E‐stained lung tissue sections (N, n = 5) were determined at the indicated time points. Scale bar, 200 μm.
Data information: All data are representative of at least three biologically independent experiments. Data from the qPCR assay are presented as the fold change relative to the Actin mRNA level. The data are presented as the means ± SDs. The significance of differences was determined by t‐tests. *P < 0.05, **P < 0.01, and ***P < 0.005.
Please see Appendix Fig S2 for information regarding replicates, quantification, and statistical evaluation for biochemical data in this figure.
Source data are available online for this figure.
