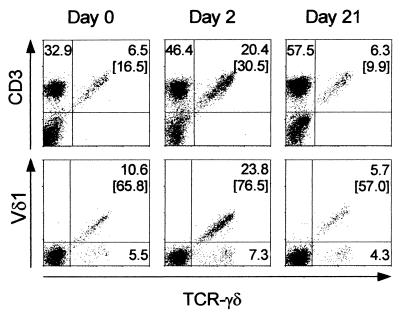
FIG. 2.
Proportions of lymphocytes (FSC/SSC [1× SSC is 0.15 M NaCl plus 0.015 M sodium citrate] gated) expressing CD3 and TcR-γδ (upper panels) and of CD3+ cells expressing Vδ1 and TCR-γδ (lower panels) in a CM patient. Samples shown were obtained on the day of admission (left panels) and 2 (middle panels) and 21 days (right panels) after initiation of chemotherapy. Numbers indicate percentages of cells in quadrants.

