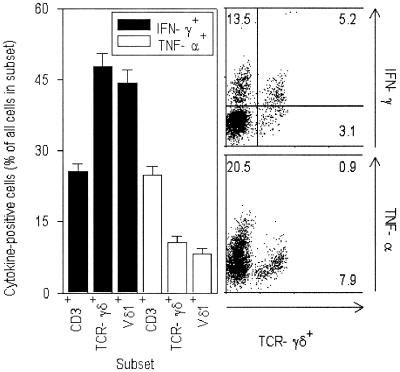
FIG. 6.
Cytokine expression by T-cell subsets following 90 min of stimulation in vitro. Left panel, proportion of subsets producing IFN-γ (filled bars) and TNF-α (open bars). Right panels, production of IFN-γ (upper panel) and TNF-α (lower panel) by CD3+ cells from a UM patient (G1611). Numbers indicate percentages of all CD3+ cells in quadrants.

