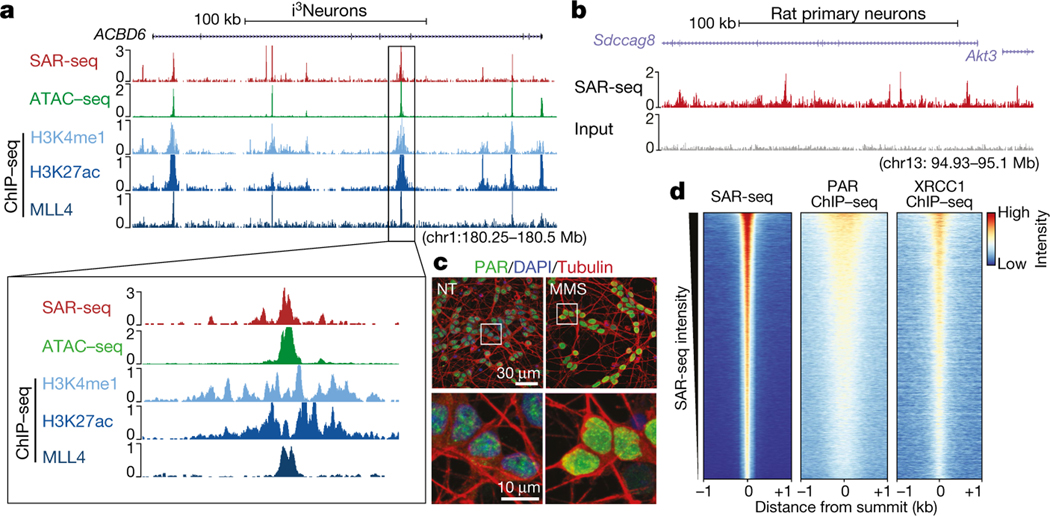
Fig. 1 |. SAR-seq peaks occur within enhancers and are associated with PARP activation.
a, Genome browser screenshots of SAR-seq (n = 3), ATAC–seq (n = 1), and ChIP–seq for H3K4me1 (n = 2), H3K27ac (n = 1), and MLL4 (n = 1) in i3Neurons. Below, expanded view of the indicated region to show overlapping peaks. b, Genome browser screenshot of SAR-seq performed in rat primary neurons (n = 1) as well as input. The culture was co-incubated with 5 μM aphidicolin to block DNA replication of S-phase glial cells. c, Representative images of i3Neurons with immunofluorescence staining for PAR (green) and the neuronal marker tubulin-β3 (red), counterstained with 4′,6-diamidino2-phenylindole (DAPI) (blue) (data are representative of three independent experiments). As a positive control, cells were treated with 0.1 mg ml−1 MMS for 15 min; NT, not treated. Boxed regions in top row are enlarged below. d, Heat maps of SAR-seq signal and ChIP–seq signals for XRCC1 and PAR for 1 kb on either side of SAR-seq peak summits in i3Neurons, ordered by SAR-seq

