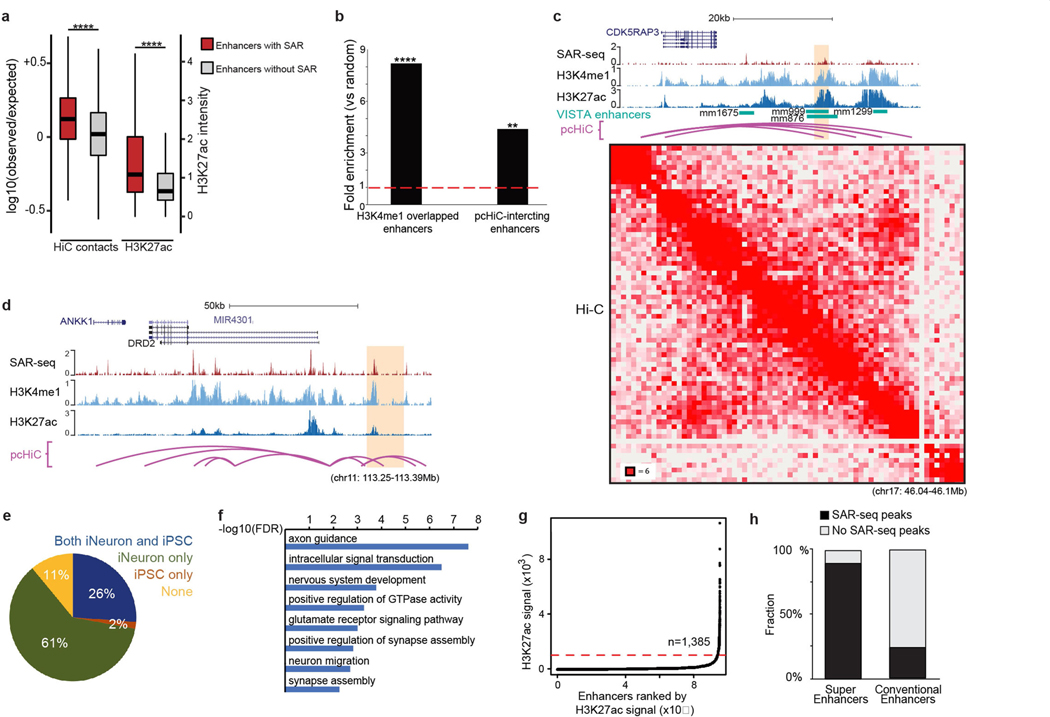
Extended Data Fig. 6 |. SAR-seq enrichment at neuronal enhancers.
a, Box plot showing Hi-C contacts (left, n = 4) and H3K27ac (right, n = 1) levels at enhancers with (red) or without (grey) SAR-seq peaks. Contacts were defined as Hi-C interactions between an H3K27ac+ enhancer (with and without SAR) and its closest promoter within the TAD domain. For comparative purposes, observed contacts were normalized to expected contacts. Centre line, median; box limits, 25th and 75th percentiles; whisker indicates 1.5× interquartile range. Statistical significance was determined using the one-sided Wilcoxon rank-sum test. P = 1.64 × 10−225 for HiC contacts and P < 2.2 × 10⁻¹⁶ for H3K27ac intensity (****P < 0.00001). b, Fold enrichment of SAR-seq peaks at in vivo-validated enhancers from the VISTA Enhancer Browser database that overlap with H3K4me1 ChIP–seq peaks (left, P = 1.42 × 10−53) or at promoter-interacting regions determined by pcHiC (right, P = 1.574 × 10⁻⁹). n = 1,000 randomly shuffled datasets were generated to test significance using one-sided Fisher’s exact test (**P < 0.001, ****P < 0.00001). c, d, Genome browser screenshots showing SAR-seq, H3K4me1 and H3K27ac ChIP–seq, and pcHiC and Hi-C profiles at representative enhancers (highlighted in orange) interacting with the CDK5RAP3 promoter (c) and the DRD2 promoter (d). Both enhancers have been validated to promote transcription of their respective genes using CRIPSR techniques in i3Neurons10. The CDK5RAP3 enhancer also overlaps with in vivo-validated enhancers from the VISTA Enhancer Browser database. In the Hi-C contact matrix (c, bottom) the intensity of each pixel represents the normalized number of contacts between a pair of loci. The maximum intensity is indicated at the lower left corner. e, Pie chart showing distribution of i3Neuron SAR-seq peaks in iPS cell-specific, i3Neuron-specific and shared iPS cell and i3Neuron enhancers. Approximately 56 million and 49 million single end reads were sequenced for the H3K4me1 ChIP–seq in iPS cell and i3Neurons, respectively, with approximately 100,000 peaks called in both cell types. f, Top biological processes enriched for genes containing the 2,000 most intense SAR-seq peaks determined by GO analysis. The x-axis represents the enrichment value as the logarithm of FDR. G, H3K27ac signal at enhancers in i3Neurons ranked by H3K27ac ChIP–seq intensity. Red dashed line indicates the inflection point of the H3K27ac signal used to identify super-enhancers (cutoff 1,000). Accordingly, 1,385 enhancers were defined as super-enhancers. h, Bar graph showing the fraction of super-enhancers (left) and conventional enhancers (right) that overlap with SAR-seq peaks. The super-enhancers in the i3Neurons were defined by H3K27ac ChIP–seq intensity in g.

