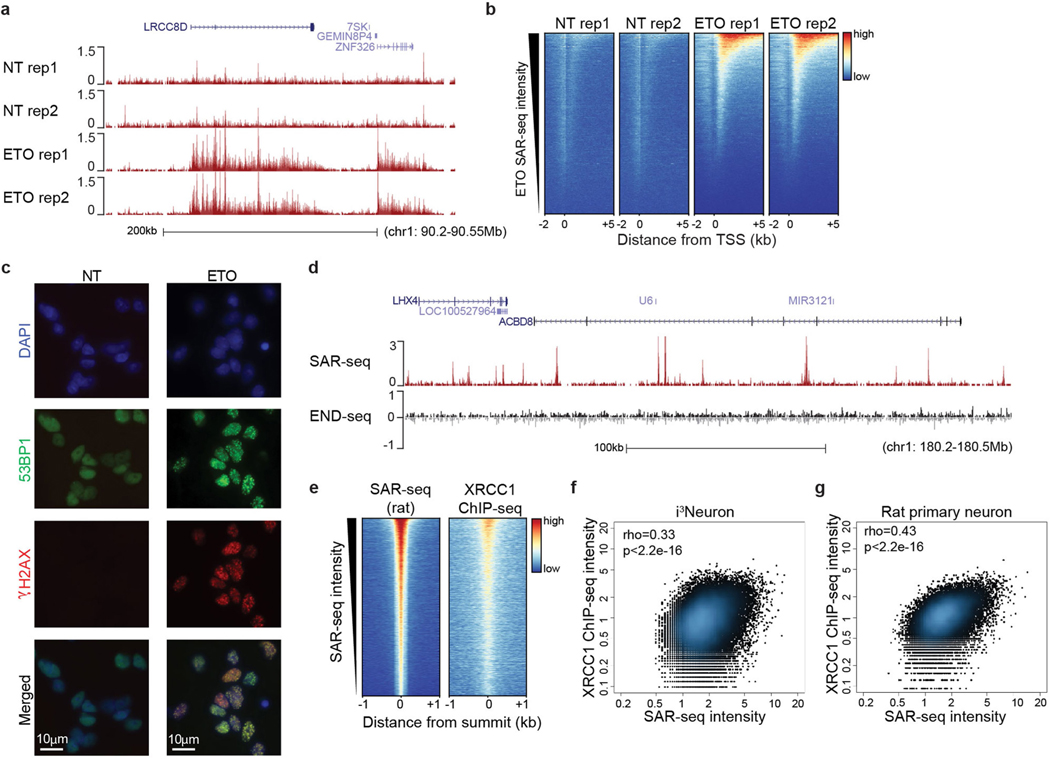
Extended Data Fig. 8 |. Mapping regions of DNA damage and repair in neurons.
a, Genome browser example of SAR-seq profiles in non-treated (NT) or etoposide (ETO)-treated (18 h, 50 μM) i3Neurons. Data are from two biological replicates. b, Heat maps for SAR-seq in nontreated (NT) or etoposide- (ETO) treated (18 h, 50 μM) i3Neurons at −2 kb to +5 kb from the transcription start sites (TSS), ordered by ETO SAR-seq intensity. c, Immunofluorescence staining of the DSB markers γH2AX (red) and 53BP1 (green) in non-treated or ETO-treated (1 h) i3Neurons. Data are representative of three independent experiments. d, Genome browser showing SAR-seq and END-seq profiles in non-treated i3Neurons. END-seq, which detects DSBs specifically19, does not detect any enriched signal (that is, above background) at SAR-seq peaks. END-seq signals are separated into positive (black) and negative (grey) strands. END-seq data are representative of two independent experiments. e, Heat maps of SAR-seq and XRCC1 ChIP–seq (n = 1) for 1 kb on either side of SAR-seq peak summits in cultured rat primary neurons, ordered by SAR-seq intensity. f, g, Scatter plots showing the correlation between SAR-seq and XRCC1 ChIP–seq intensities (RPKM) for 1 kb before and after SAR-seq peak summits in i3Neurons (f) and rat primary neurons (g). Spearman correlation coefficients and P values are indicated.

