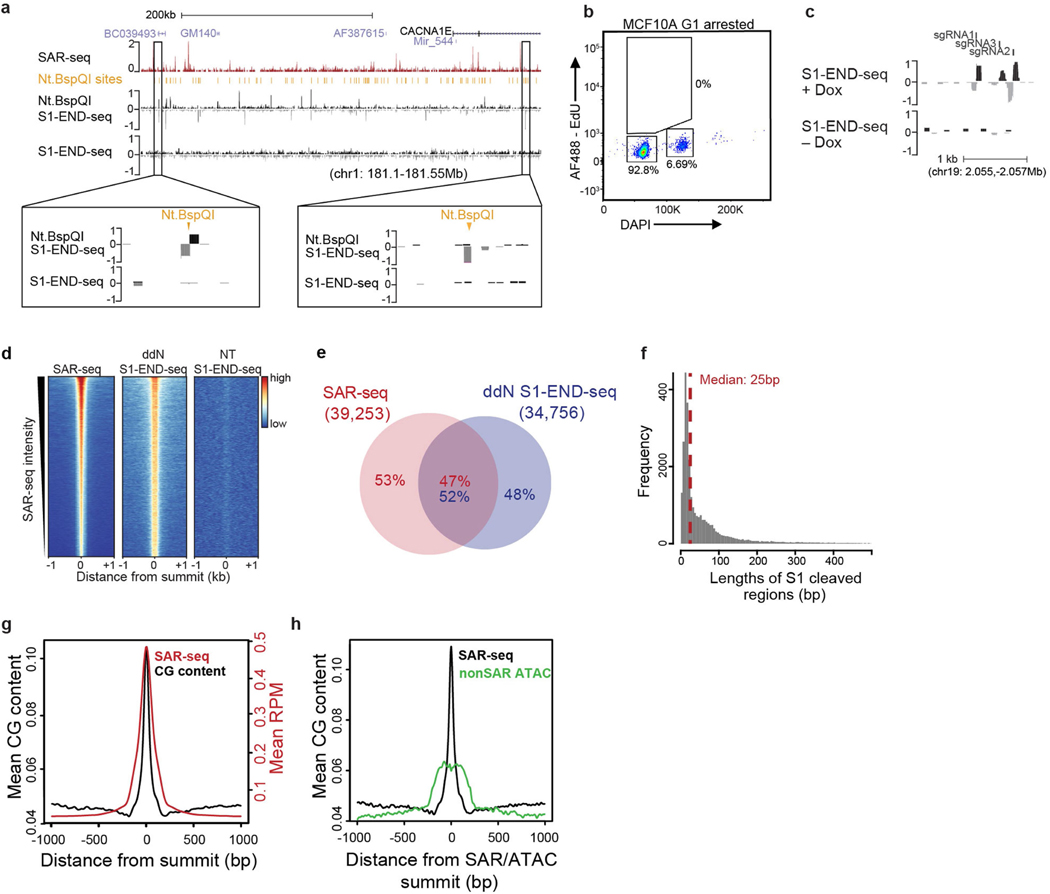
Extended Data Fig. 9 |. S1 END-seq mapping of SSBs.
a, Top, genome browser screenshot showing profiles of SAR-seq and S1 END-seq. Agarose plugs were incubated with or without the restriction enzyme Nt.BspQI before S1 treatment (n = 1). Bottom, expanded views of Nt.BspQI sites (tick mark) show detection of S1 END-seq upon Nt.BspQI treatment. S1 END-seq reads are separated into positive (black) and negative (grey) strands. b, Flow cytometry profile of G1-arrested MCF10A cells pulsed with EdU. MCF10A cells were treated with palbociclib (1 μM) for 48 h to arrest cells in G1. Doxycycline was added in the last 24 h to induce nickase expression. Data are representative of three independent experiments. For an example of the gating strategy used for flow cytometry in b and Extended Data Fig. 2c, see Supplementary Fig. 1. c, Genome browser screenshot showing S1 END-seq profiles at three Cas9 nickase targeting sites (tick marks: sgRNAs 1–3) in G1-arrested MCF10A cells treated with doxycycline (+Dox) to induce Cas9 expression (n = 1). S1 END-seq signals are separated into positive (black) and negative (grey) strands. d, Heat maps of SAR-seq and S1 END-seq signals in i3Neurons with ddN or without incubation (NT) for 1 kb on either side of the SAR-seq peak summits, ordered by SAR-seq intensity. e, Venn diagram showing the overlap between S1 END-seq peaks incubated with ddN and SAR-seq peaks in i3Neurons. n = 1,000 randomly shuffled datasets were generated to test the significance using one-sided Fisher’s exact test: P < 2.2 × 10⁻¹⁶. f, Distribution of the size of the gaps between positive- and negative-strand S1 END-seq peak summits in i3Neurons incubated with ddN. The median gap size is 25 bp (red dashed line). The positive-strand peak represents the right end and the negative-strand peak represents the left end of a detected DSB. g, Aggregate plot showing the distribution of CG dinucleotides (black) for 1 kb on either side of SAR-seq peak summits overlaid with SAR-seq signal (red). h, Aggregate plot showing the distribution of CG dinucleotides (black) for 1 kb on either side of SAR-seq peak summits or summits of ATAC–seq peaks (green) that are H3K4me1 positive but do not overlap with SAR-seq.

