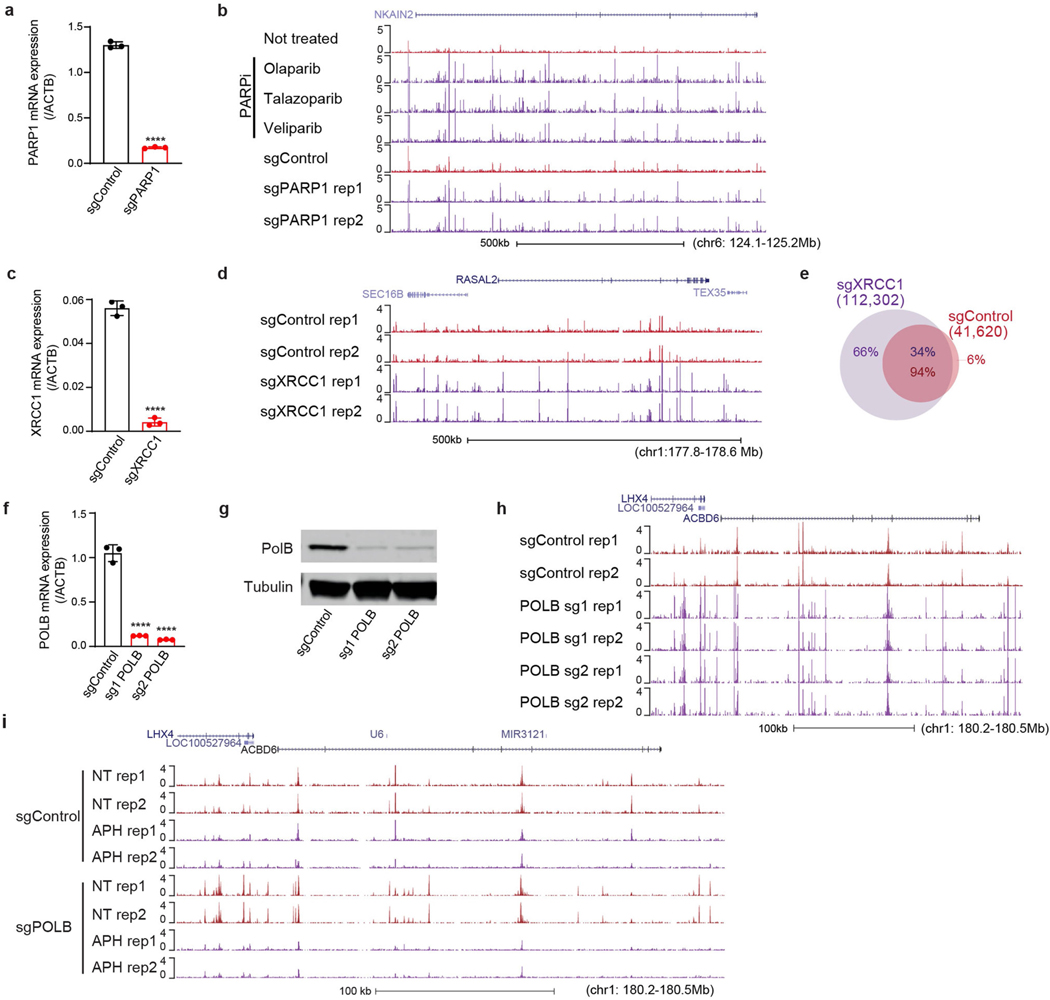
Extended Data Fig. 10 |. PARP, XRCC1 or POLB deficiency increases SAR.
a, Quantitative RT–PCR analysis showing the PARP1 mRNA transcript level in i3Neurons after CRISPRi knockdown (sgControl, control non-targeting sgRNA; sgPARP1, an sgRNA targeting PARP1), cultured in parallel with samples used for SAR-seq. P = 7.72 × 10⁻⁷ by unpaired two-tailed Student’s t-test; ****P < 0.00001 (n = 3). b, Genome browser screenshot displaying SAR-seq profiles from two biological replicates of i3Neurons treated with the PARP inhibitors olaparib, talazoparib, or veliparib, or using CRISPRi-mediated knockdown with sgControl or sgPARP1, in duplicates. NT, not treated. c, Quantitative RT–PCR analysis showing XRCC1 mRNA transcript level in i3Neurons after CRISPRi knockdown, cultured in parallel with samples used for SAR-seq. P = 1.88 × 10⁻⁵ by unpaired two-tailed Student’s t-test; ****P < 0.00001 (n = 3). d, Genome browser screenshots of SAR-seq profiles in i3Neurons expressing sgControl or sgXRCC1, in duplicate. e, Venn diagram showing the overlap of SAR-seq peaks between i3Neurons expressing sgControl and those expressing sgXRCC1. n = 1,000 random datasets were generated to test the significance of overlap (one-sided Fisher’s exact test: P < 2.2 × 10⁻¹⁶). f, Quantitative RT–PCR analysis showing POLB mRNA transcript levels in i3Neurons after CRISPRi knockdown, cultured in parallel with samples used for SAR-seq. P = 6.98 × 10⁻⁵ for sgPOLB1 and 5.82 × 10⁻⁵ for sgPOLB2 by unpaired two-tailed Student’s t-test; ****P < 0.00001 (n = 3). g, Western blot showing POLB protein levels in i3Neurons after CRISPRi knockdown, cultured in parallel with samples used for SAR-seq (n = 1). For gel source data, see Supplementary Fig. 2. h, Genome browser screenshots of SAR-seq profiles from two biological replicates of i3Neurons expressing sgControl or sgPOLB, in duplicate. i, Genome browser screenshots of SAR-seq profiles from two biological replicates of i3Neurons expressing sgControl or sgPOLB. Cells were pre-treated or not treated (NT) with 50 μM Aph for 24 h, and then also during incubation with EdU.

