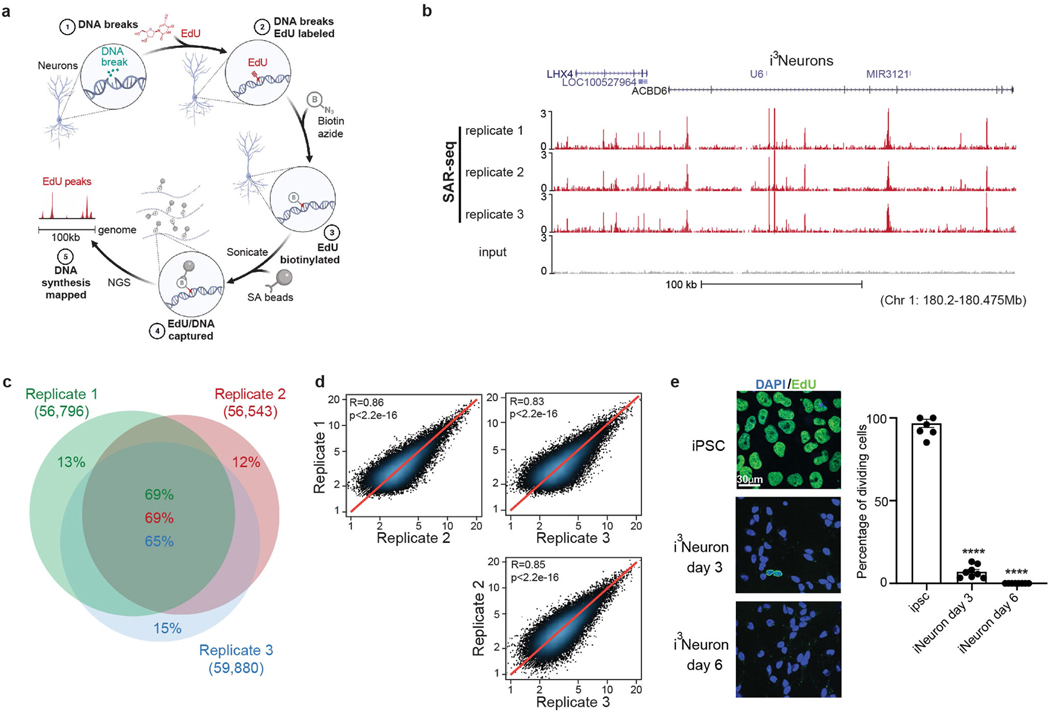
Extended Data Fig. 1 |. Discrete genomic loci in neurons are associated with ongoing DNA synthesis.
a, Schematic of SAR-seq (DNA synthesis associated with repair sequencing) methodology. Neurons grown in culture (1) are incubated with EdU to label sites of DNA repair synthesis (2). The incorporated genomic EdU is then conjugated to biotin via click chemistry (3), sheared by sonication to fragments of 150–200 bp and captured with streptavidin beads (4). Enriched DNA sequences are then PCR-amplified and subjected to next-generation sequencing (5). b, Genome browser screenshot displaying SAR-seq profiles as normalized read density (RPM) for i3Neurons. Three independent biological replicates are shown as well as input. Neurons were labelled with EdU for 18 h and collected on day 7 after induction of neuronal differentiation. All coordinates provided are from the hg19 reference genome for i3Neurons. c, Venn diagram showing the overlap of SAR-seq peaks in i3Neurons for three independent biological replicates. d, Scatter plots showing correlations of SAR-seq intensities (RPKM) between three replicates in i3Neurons. Pearson correlation coefficients and P values are indicated. e, Left, representative images of EdU–biotin staining (green) showing cell proliferation in iPS cells, but not in post-mitotic i3Neurons. i3Neurons were treated with EdU on day 3 or day 6 and fixed on day 7. iPS cells were treated with EdU for 24 h and fixed. Cells were counterstained with DAPI (blue). Different imaging conditions were used for iPS cells and i3Neurons in the representative images. Right, quantification of EdU-positive cells. Each dot represents the percentage of dividing cells in one image (iPS cell: n = 8 images, n = 397/410 cells EdU-positive; i3Neuron day 3: n = 8 images, n = 35/483 cells EdU-positive; i3Neuron day 7: n = 8 images, n = 0/523 cells EdU-positive). Data are mean ± s.e.m. and are representative of three independent experiments.

