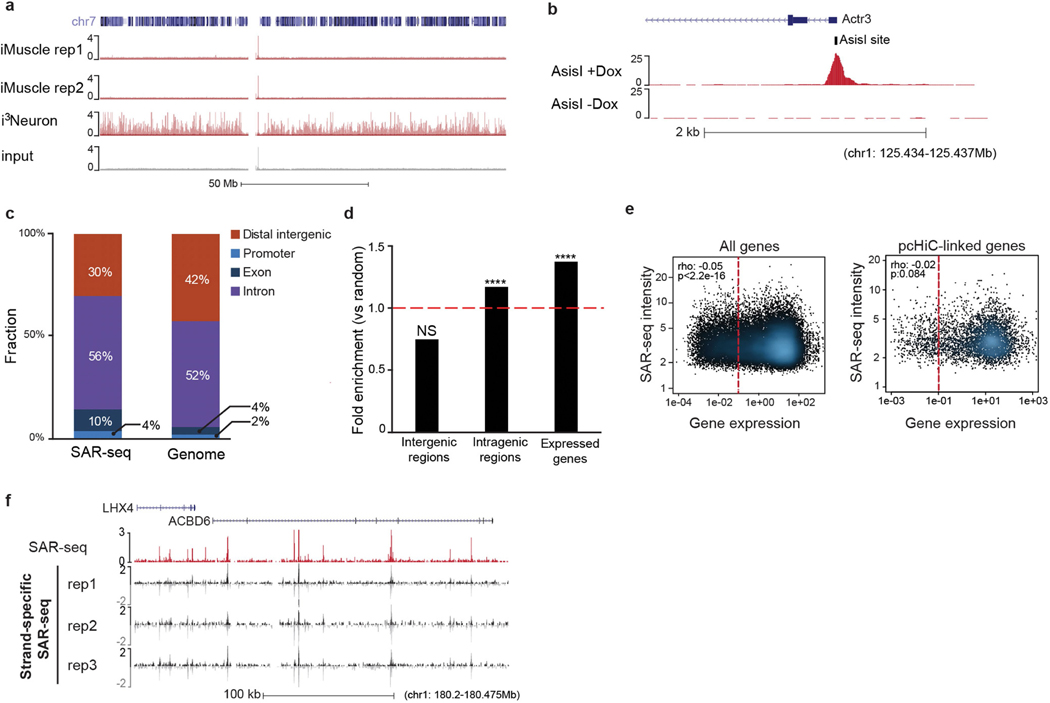
Extended Data Fig. 3 |. SAR-seq enrichment at neuronal intragenic regions.
a, Genome browser screenshot of chromosome 7 showing lack of localized DNA synthesis in two independent biological replicates of SAR-seq performed in iMuscle cells (n = 2) incubated with EdU for 18 h compared to SAR-seq in i3Neurons as well as input DNA. b, Genome browser screenshot displaying SAR-seq peak at a representative AsiSI restriction enzyme site (tick mark). AsiSI expression was induced for 18 h (+Dox, n = 1) compared with non-treated (−Dox, n = 1) conditions in G0-arrested, Abelson virus-transformed mouse pre-B cells as described19. c, Distribution of SAR-seq peaks with respect to different genomic features compared to genome-wide distribution of the hg19 human reference genome. Promoters are defined as 1 kb upstream of transcription start sites. Distal intergenic represents promoter-excluded intergenic regions. d, Fold enrichment of SAR-seq peaks in intergenic regions, intragenic regions and expressed genes compared to 1,000 sets of randomly shuffled regions of the same sizes and chromosome distribution (one-sided Fisher’s exact test, ****P < 2.2 × 10⁻¹⁶; NS, not significant). e, Left, scatterplot showing correlation of SAR-seq intensity (RPKM) with transcript level of genes containing SAR-seq peaks measured by RNA-seq (FPKM; n = 3) in i3Neurons. Seventy-one per cent of SAR-seq peaks are at expressed genes (FPKM ≥ 0.1; red dashed line, FPKM = 0.1). Right, correlation of SAR-seq intensity with transcript levels of linked genes determined by pcHiC in i3Neurons (red dashed line, FPKM = 0.1). Spearman correlation coefficients and P values are indicated. f, Genome browser screenshot comparing SAR-seq with strand-specific SAR-seq (n = 3), which discriminates which strand is labelled with EdU in i3Neurons. Both strands show labelling in three biological replicates. Strand-specific SAR-seq reads are separated into positive (black) and negative (grey) strands.

