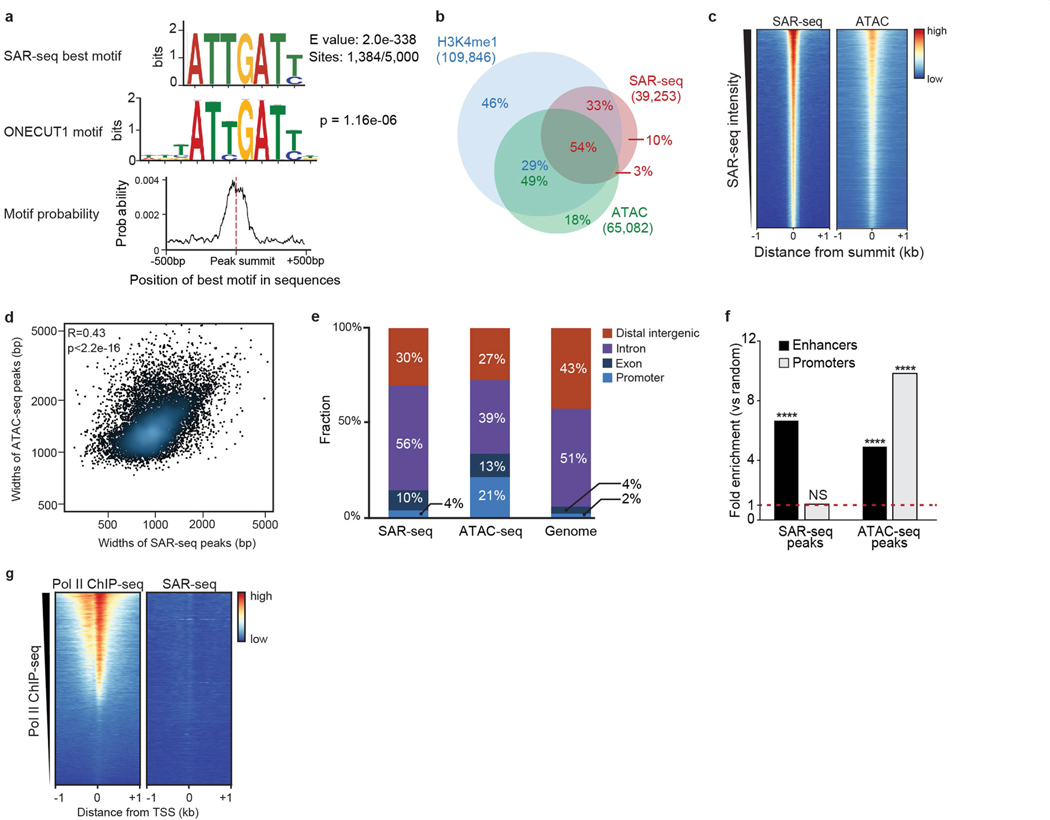
Extended Data Fig. 4 |. Motif discovery of SAR peaks and comparison with ATAC–seq peaks.
a, Motif analysis for sequences within 500 bp of the summit of the top 5,000 SAR-seq peaks in i3Neurons. Top, the best motif discovered by the MEME suite (1,384 out of 5,000 sites have this motif). Middle, TOMTOM motif tool used to compare SAR-seq motif shown above with databases of known motifs. The transcription factor ONECUT1 was identified as the most similar motif and its consensus sequence is shown. P value for motif comparison with ONECUT1 motif is indicated. Bottom, position distribution of the best motif (top) within 500 bp of the SAR-seq peak summit. The best motif is centred on the SAR-seq peak summit. b, Venn diagram illustrating the overlap between H3K4me1 ChIP–seq, ATAC–seq and SAR-seq peaks in i3Neurons. The statistical significance of the overlaps between SAR-seq, H3K4me1 ChIP–seq and ATAC–seq peaks was determined using randomly shuffled data sets (n = 1,000) by one-sided Fisher’s exact test (the P value for overlap between H3K4me1 ChIP–seq and SAR-seq peaks is P < 2.2 × 10⁻¹⁶, and for ATAC–seq/SAR-seq peaks is P < 2.2 × 10⁻¹⁶). Fraction of different overlapping groups are labelled in red for SAR-seq peaks, green for ATAC–seq peaks and blue for H3K4me1 ChIP–seq peaks. c, Heat maps of SAR-seq and ATAC–seq signals within 1 kb of SAR-seq peak summits in i3Neurons, ordered by SAR-seq intensity. d, Scatter plot comparing widths of ATAC–seq peaks and SAR-seq peaks for the top 10,000 overlapping peaks in i3Neurons. Pearson correlation coefficient and P value are indicated. e, Distribution of SAR-seq and ATAC–seq peaks with respect to different genomic features compared to genome-wide distribution on the hg19 human reference genome. Promoters are defined as 1 kb upstream of transcription start sites and distal intergenic represents promoter-excluded intergenic regions. f, Fold enrichment of SAR-seq and ATAC–seq peaks located at enhancers (black) and promoters (grey) compared to 1,000 sets of randomly shuffled regions of the same sizes and chromosome distributions, respectively (one-sided Fisher’s exact test, ****P < 2.2 × 10⁻¹⁶, NS: P = 0.0783, not significant). g, Heat map of RNA Pol II (n = 1) ChIP–seq and SAR-seq in i3Neurons for 1 kb on either side of the transcription start site (TSS) in i3Neurons, ordered by Pol II ChIP–seq intensity.

