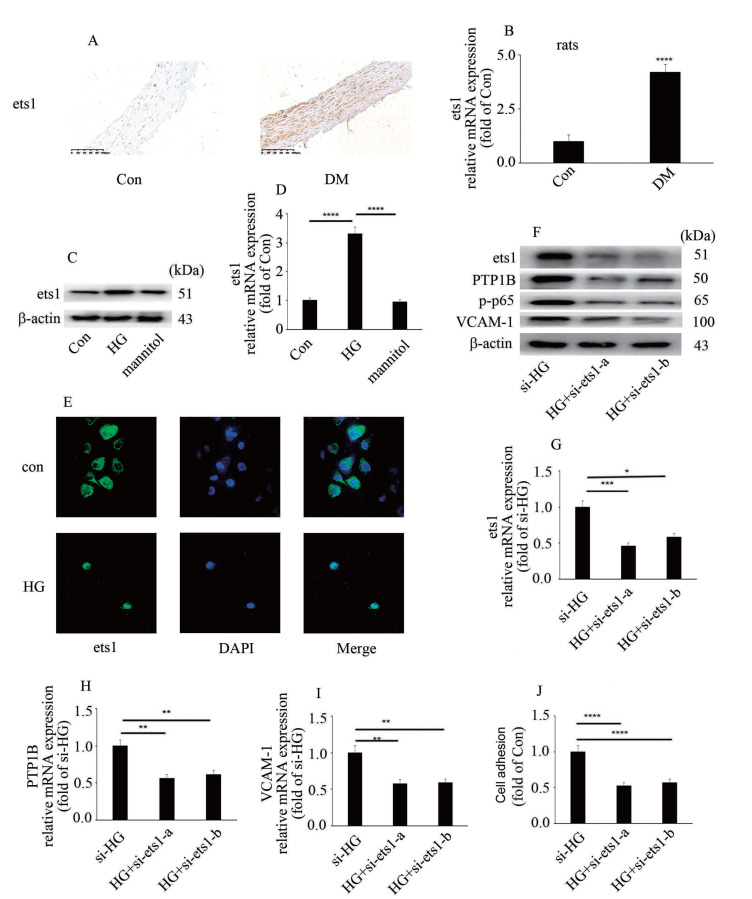
Figure4 .
Ets1 downregulation inhibits high glucose-induced endothelial inflammation and PTP1B expression
(A) Immunohistochemical staining of ets1 in aorta biopsy specimen of rats with corresponding treatments (n=10/group; scale bar: 100 μm). (B) mRNA levels of ets1 in aorta of DM rats. (C) The protein expression of ets1 in HUVECs with corresponding treatments. (D) The mRNA expression of ets1 in HUVECs with corresponding treatments. (E) The distribution of ets1 in HUVECs with corresponding treatments. (F) The protein expressions of ets1, PTP1B, VCAM-1 and p65 phosphorylation in HUVECs with corresponding treatments. (G) The mRNA expression of ets1 in HUVECs with corresponding treatments. (H) The mRNA expression of PTP1B in HUVECs with corresponding treatments. (I) The mRNA expression of VCAM-1 in HUVECs with corresponding treatments. (J) Monocyte/endothelial adhesion with corresponding treatments. *P<0.05, **P<0.01, ***P<0.001, ****P<0.0001, n=10/group.

