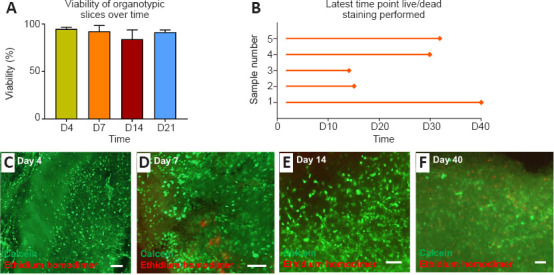
Figure 2.

Study outcomes and viability assessment of cerebellar tissue slices.
Bar chart (A) showing quantification of slice health, as detected by calcein/ethidium homodimer staining, at different culture times (data expressed as the mean ± SEM). Chart (B) showing the latest time point live/dead staining was performed on individual slices for each Chiari sample. Representative fluorescent micrographs show tissue viability of individual slices at 4, 7, 14, and 40 days post-surgical excision (C–F, respectively). LIVE: Calcein (green); DEAD: ethidium homodimer (red). Scale bars: 100 µm.
