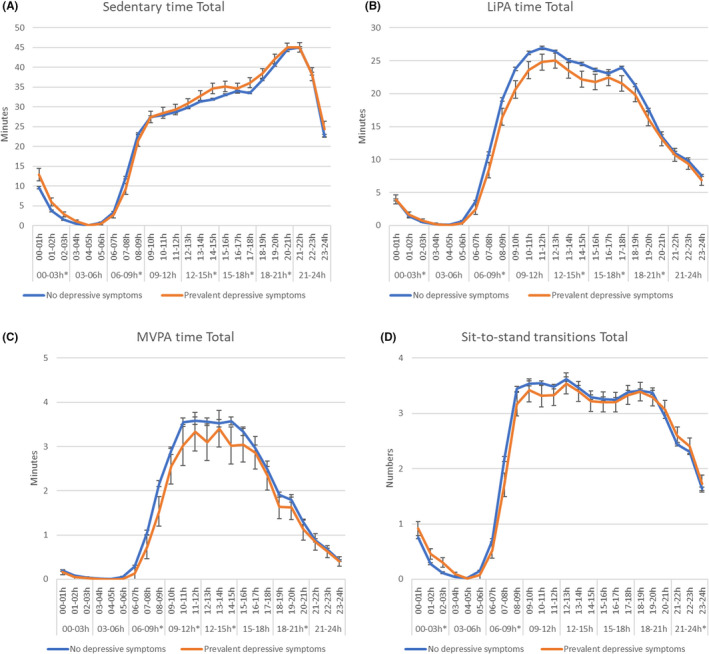
FIGURE 2.

Hourly distribution of (A) sedentary time, (B) LiPA, (C) MVPA, and (D) sit‐to‐stand transitions in individuals with and without prevalent depressive symptoms. Statistically significant differences in time slots are reported with*. Model 3: adjusted for age, sex, level of education, type 2 diabetes, smoking status, alcohol consumption, energy intake, BMI, hypertension, cholesterol, history of CVD.
