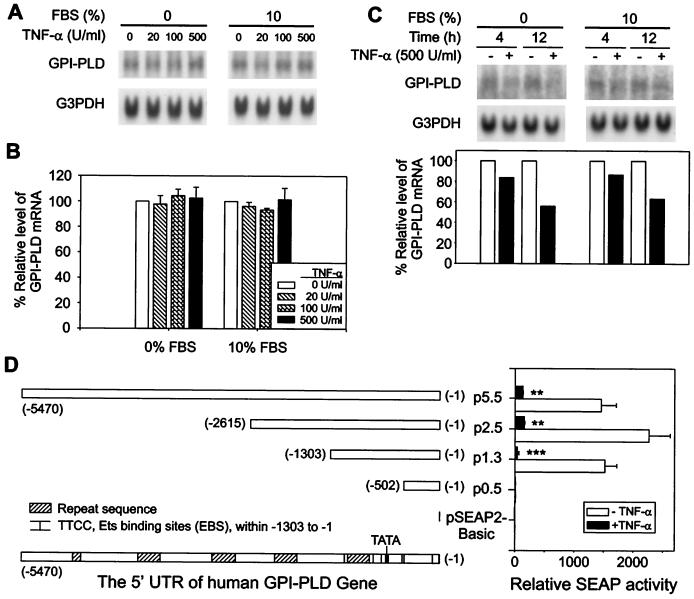
FIG. 7.
TNF-α reduces GPI-PLD expression in human alveolar carcinoma cell line A549 but not in murine macrophage cell line RAW 264.7. (A) The GPI-PLD mRNA level in RAW 264.7 cells was not affected by TNF-α stimulation. RAW 264.7 cells were untreated or treated with TNF-α at the indicated concentrations for 4 h in either serum-free medium or 10% FBS-containing medium. Total RNA was prepared and analyzed by Northern blotting. Top, representative blots hybridized with 32P-labeled GPI-PLD cDNA; bottom, same blot hybridized with 32P-G3PDH. (B) Relative levels of GPI-PLD mRNA in stimulated cells compared to nonstimulated cells with and without the presence of serum. Results are depicted as means ± SE for three independent experiments. (C) Reduction of GPI-PLD mRNA upon TNF-α stimulation in A549 cells is independent of serum. A549 cells were untreated or treated with 500 U of TNF-α per ml in either serum-free medium or 10% FBS-containing medium. Samples were taken at 4 and 12 h, and total RNA was prepared and analyzed by Northern blotting. Shown are representative blots hybridized sequentially with 32P-labeled GPI-PLD cDNA and 32P-G3PDH along with quantification data. (D) TNF-α reduces the expression of SEAP driven by the human GPI-PLD promoter in A549 cells. The four promoter constructs are shown schematically on the left. The positions of five repeat sequences along the 5.5-kb 5′ untranslated region were predicted by using the Repeat Masker server at the University of Washington (http://ftp.genome.washington.edu/) and indicated by gray boxes. The TATA box of the strong promoter located within -502 to -1303 is indicated by a vertical bar. The distribution of 10 potential EBS (TTCC) detected within -1 to -1303 is also denoted by thin vertical bars. A549 cells were transiently transfected with promoter constructs containing a SEAP reporter gene. TNF-α (500 U/ml) treatment and measurement of SEAP activity are described in Materials and Methods. Results are depicted as means ± SE for four independent transfection experiments. ∗∗, P < 0.01; ∗∗∗, P < 0.001.

