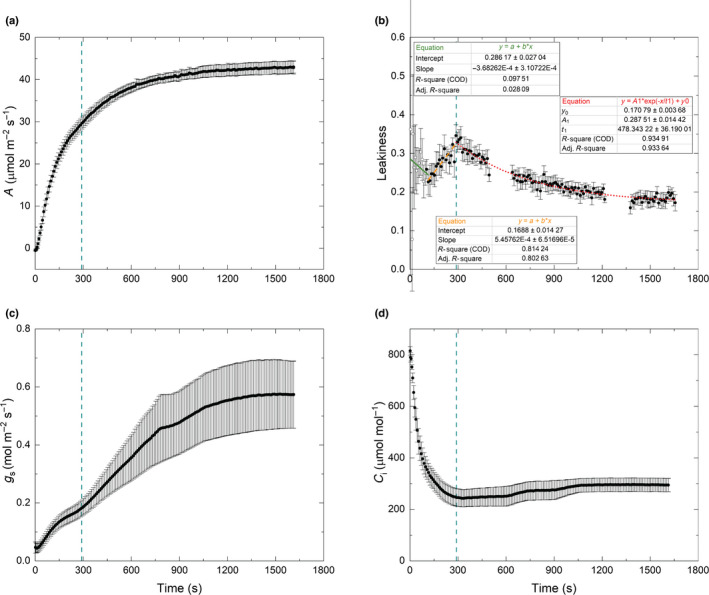
Fig. 2.

CO2 assimilation and bundle‐sheath leakiness during photosynthetic induction of sorghum measured with an LI‐6400XT coupled to a tunable diode laser absorption spectroscope (TDL). (a) CO2 assimilation rate (A). (b) Bundle‐sheath leakiness (ϕ, Eqn 12). Open dots represent the data points derived from values of observed discrimination that had large uncertainty (the error in the calculated Δ13Cobs was > 50% of its calculated value). (c) Stomatal conductance to water vapor (g s). (d) Intercellular CO2 concentration (C i). The dotted vertical lines mark the time of highest leakiness, which was 286 s. t 1 is the time constant (τ) of the exponential curve for leakiness. Time 0 s is when the light was switched on to 1800 μmol m−2 s−1. Each data point is the mean (±SE) of eight plants (n = 8).
