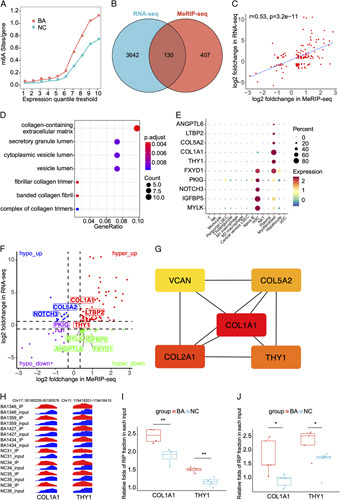
FIGURE 3.

The combined analysis of methylated RNA immunoprecipitation sequencing (MeRIP-seq) and RNA sequencing in biliary atresia and normal controls (NC). (A) The densities of the m6A peaks in biliary atresia (BA) and NC. (B) Venn diagram of the differential m6A peak-related genes and differentially expressed genes in BA and NC. (C) The correlation between the log2foldchange of m6A enrichment and log2foldchange of RNA expressions. (D) Gene Ontology (GO) analysis of the overlapping genes. (E) The expressions of fibrotic overlapping genes in the scRNA dataset of GSE136103. (F) Four-quadrant diagram of the overlapping genes. (G) Top 5 hub genes in the protein-protein interaction network. (H) IGV-browser visualization of the m6A peaks of COL1A1 and THY1 in each sample. (I) MeRIP-seq displaying the m6A enrichment alternations of COL1A1 and THY1 in 4 BA and 4 NC. (J) MeRIP-qPCR displaying the m6A enrichment alternations of COL1A1 and THY1 in 5 BA and 5 NC. *p < 0.05, **p < 0.01.
